
Compare Sangam Finserv with Similar Stocks
Dashboard
With a Operating Losses, the company has a Weak Long Term Fundamental Strength
- Poor long term growth as Net Sales has grown by an annual rate of -6.66% and Operating profit at -16.64%
Negative results in Mar 26
With ROE of 1.4, it has a Very Expensive valuation with a 1.3 Price to Book Value
Stock DNA
Non Banking Financial Company (NBFC)
INR 178 Cr (Micro Cap)
91.00
21
0.00%
0.40
1.44%
1.30
Total Returns (Price + Dividend) 
Latest dividend: 0.24 per share ex-dividend date: Sep-19-2018
Risk Adjusted Returns v/s
Returns Beta

News
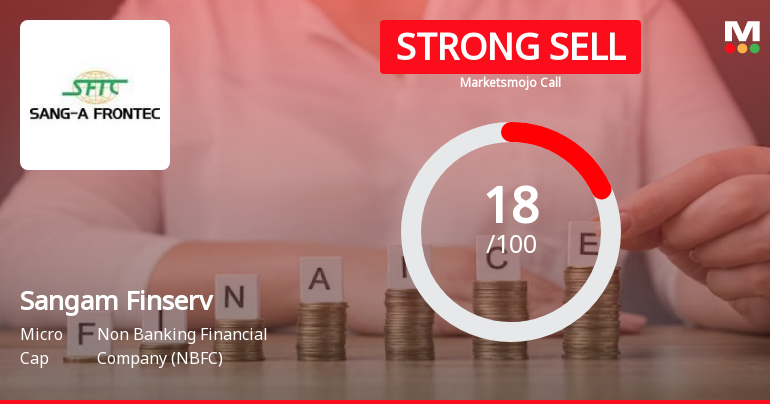
Sangam Finserv Ltd is Rated Strong Sell
Sangam Finserv Ltd is rated Strong Sell by MarketsMOJO, with this rating last updated on 15 April 2026. However, the analysis and financial metrics discussed here reflect the stock’s current position as of 16 July 2026, providing investors with an up-to-date view of the company’s fundamentals, valuation, financial trends, and technical outlook.
Read full news article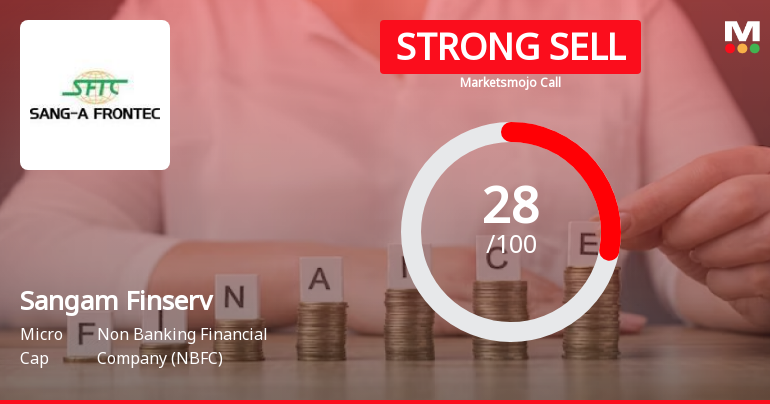
Sangam Finserv Ltd is Rated Strong Sell
Sangam Finserv Ltd is rated Strong Sell by MarketsMOJO, with this rating last updated on 15 Apr 2026. However, the analysis and financial metrics discussed here reflect the stock's current position as of 05 July 2026, providing investors with an up-to-date view of the company’s fundamentals, valuation, financial trends, and technical outlook.
Read full news article
Sangam Finserv Ltd is Rated Strong Sell
Sangam Finserv Ltd is rated Strong Sell by MarketsMOJO, with this rating last updated on 15 Apr 2026. However, the analysis and financial metrics discussed here reflect the stock's current position as of 24 June 2026, providing investors with an up-to-date view of the company’s fundamentals, valuation, financial trend, and technical outlook.
Read full news article Announcements
Compliances-Certificate under Reg. 74 (5) of SEBI (DP) Regulations 2018
11-Jul-2026 | Source : BSECompliance Certificate under Regulation 74(5) of SEBI (Depositories and Participants) Regulations 2018 for the Quarter ended 30th June 2026
Closure of Trading Window
27-Jun-2026 | Source : BSEIntimation of closure of trading window
Compliances-Reg.24(A)-Annual Secretarial Compliance
29-May-2026 | Source : BSEAnnual Secretarial Compliance Report for the Financial year ended 31st March 2026
Corporate Actions

No Upcoming Board Meetings

Sangam Finserv Ltd has declared 12% dividend, ex-date: 19 Sep 18

No Splits history available

Sangam Finserv Ltd has announced 4:1 bonus issue, ex-date: 07 Feb 25

No Rights history available
Quality key factors
Valuation key factors
Technicals key factors
 Technical Indicator Scale: Bearish, Mildly Bearish, Sideways, Mildly Bullish, Bullish Turned
 Shareholding Snapshot : Mar 2026
Shareholding Compare (%holding)
Promoters
None
Held by 0 Schemes
Held by 0 FIIs
Marigold Investrade Private Limited (63.08%)
Ram Pal Soni (11.75%)
15.86%
Quarterly Results Snapshot (Standalone) - Mar'26 - YoY

YoY Growth in quarter ended Mar 2026 is -213.19% vs -80.64% in Mar 2025

YoY Growth in quarter ended Mar 2026 is -220.47% vs -233.59% in Mar 2025
Half Yearly Results Snapshot (Standalone) - Sep'25
Growth in half year ended Sep 2025 is 32.06% vs 0.66% in Sep 2024
Growth in half year ended Sep 2025 is 31.41% vs 4.93% in Sep 2024
Nine Monthly Results Snapshot (Standalone) - Dec'25
YoY Growth in nine months ended Dec 2025 is 2.55% vs 16.15% in Dec 2024
YoY Growth in nine months ended Dec 2025 is -10.36% vs 25.38% in Dec 2024
Annual Results Snapshot (Standalone) - Mar'26
YoY Growth in year ended Mar 2026 is -8.94% vs -8.40% in Mar 2025
YoY Growth in year ended Mar 2026 is -50.61% vs -16.46% in Mar 2025
About Sangam Finserv Ltd

Company Coordinates


