
Key Events This Week
11 June: Mojo Grade downgraded to Sell amid valuation and financial concerns
12 June: Valuation shift signals expensive terrain despite stellar returns
Week Close: Stock steady at ₹48.28, Sensex up 0.57%
Jul 17, 03:30 PM
BSE+NSE Vol: 100
Iron & Steel Products
INR 21 Cr (Micro Cap)
145.00
NA
0.00%
4.36
2.44%
3.72
Crimson Metal for the last several years.

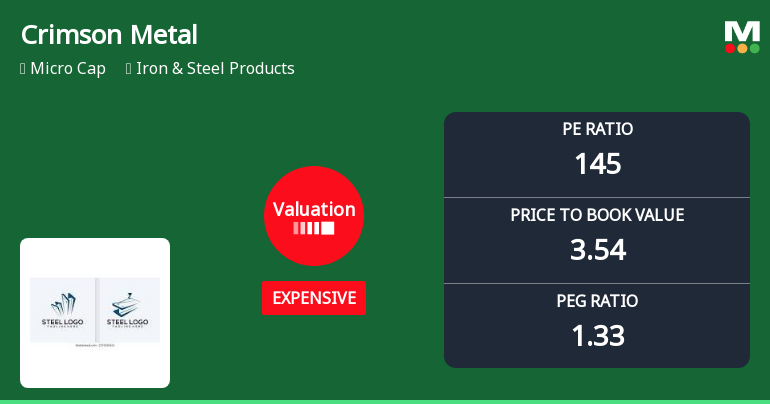
Crimson Metal Engineering Company Ltd has witnessed a significant shift in its valuation parameters, moving from a risky to an expensive classification. Despite this, the micro-cap stock has delivered stellar returns over the past year and beyond, outperforming the Sensex by a wide margin. However, the elevated price-to-earnings and price-to-book ratios raise questions about the stock’s price attractiveness relative to its peers and historical benchmarks.
Read full news article
11 June: Mojo Grade downgraded to Sell amid valuation and financial concerns
12 June: Valuation shift signals expensive terrain despite stellar returns
Week Close: Stock steady at ₹48.28, Sensex up 0.57%
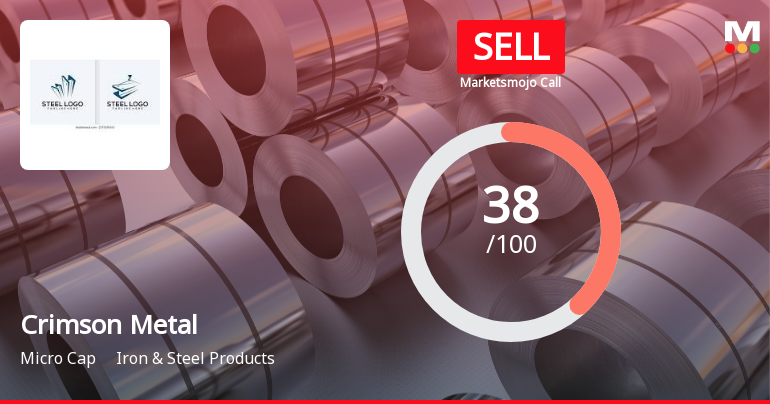
Crimson Metal Engineering Company Ltd, a micro-cap player in the Iron & Steel Products sector, has been assigned a Sell rating with a Mojo Score of 38.0, reflecting concerns across valuation, financial trends, and quality parameters despite a recent mild improvement in technical indicators. The downgrade from a previously ungraded status highlights the challenges the company faces amid flat financial performance and stretched valuation metrics.
Read full news articlePlease find enclosed the Certificate under the Regulation 74(5) of SEBI (Depositories and Participants) Regulations 2018 for the quarter ended on June 30 2026 received from Skyline Financial Service Pvt. Ltd. Registrar and Share Transfer Agent.
Pursuant to the provisions of SEBI (Prohibition of Insider Trading) Regulations 2015 we wish to inform you that the trading window for trading securities of the company will remain closed from Wednesday 1st July 2026 and shall continue to remain closed till 48 hours after the date of declaration of the Unaudited Finanacial Results for the Quarter ending on June 30 2026.
Pursuant to Regulation 30 of SEBI(LODR) Regulations 2015 & SEBI circular No. HO/38/13/11(2)2026-MIRSD-POD/I/3750/2026 dated January 30 2026 we are enclosing herewith the copies of Newspaper Advertisements published today i.e. Tuesday June 16 2026 in the Trinity Mirror (English Language Daily Newspaper) and Makkal Kural (Chennai Language Daily Newspaper) intimating that the special window has been reopened for Re-lodgement of Transfer and Dematerialisation of Physical shares.

No Upcoming Board Meetings

No Dividend history available

No Splits history available

No Bonus history available

No Rights history available
 Technical Indicator Scale: Bearish, Mildly Bearish, Sideways, Mildly Bullish, Bullish Turned
 Non Institution
None
Held by 0 Schemes
Held by 0 FIIs
Premchand Goyal (10.15%)
Janarthanan (31.45%)
15.63%

QoQ Growth in quarter ended Mar 2026 is 1.62% vs -14.75% in Dec 2025

QoQ Growth in quarter ended Mar 2026 is -25.00% vs -20.00% in Dec 2025
Growth in half year ended Sep 2025 is -10.66% vs 14.39% in Sep 2024
Growth in half year ended Sep 2025 is -22.22% vs 800.00% in Sep 2024
YoY Growth in nine months ended Dec 2025 is -9.85% vs 9.66% in Dec 2024
YoY Growth in nine months ended Dec 2025 is -21.43% vs 100.00% in Dec 2024
YoY Growth in year ended Mar 2026 is -17.24% vs 15.58% in Mar 2025
YoY Growth in year ended Mar 2026 is 7.69% vs 109.77% in Mar 2025


