
Compare D B Corp with Similar Stocks
Stock DNA
Media & Entertainment
INR 3,581 Cr (Small Cap)
11.00
11
3.52%
-0.28
13.67%
1.46
Total Returns (Price + Dividend) 
Latest dividend: 2 per share ex-dividend date: Jan-22-2026
Risk Adjusted Returns v/s
Returns Beta

News

D B Corp Ltd Downgraded to Sell by MarketsMOJO Amid Technical Weakness and Flat Financials
D B Corp Ltd, a leading player in the Media & Entertainment sector, has seen its investment rating downgraded from Hold to Sell, driven primarily by deteriorating technical indicators despite maintaining a very attractive valuation profile. The downgrade reflects a complex interplay of factors across quality, valuation, financial trends, and technicals, signalling caution for investors amid recent market underperformance.
Read full news article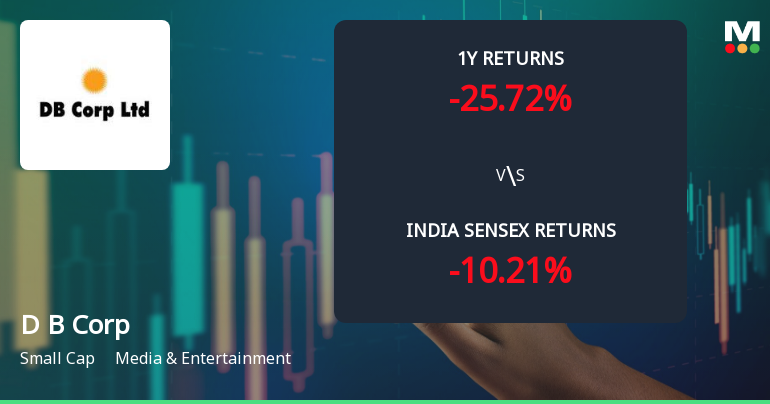
D B Corp Ltd Technical Momentum Shifts Amid Bearish Sentiment
D B Corp Ltd has experienced a notable shift in its technical momentum, with key indicators signalling a transition from mildly bearish to bearish trends. The stock’s recent performance, combined with mixed technical signals across multiple timeframes, suggests caution for investors amid a challenging market environment for this small-cap media and entertainment company.
Read full news article
D B Corp Ltd Valuation Shifts to Very Attractive Amid Market Challenges
D B Corp Ltd, a key player in the Media & Entertainment sector, has seen its valuation metrics shift markedly towards the attractive end of the spectrum despite recent share price declines and broader market headwinds. The company’s price-to-earnings (P/E) ratio now stands at 10.81, signalling a very attractive valuation compared to its historical averages and peer group, while its price-to-book value (P/BV) has settled at 1.48. This repositioning comes amid a challenging market environment where the stock has underperformed the Sensex over multiple time horizons.
Read full news article Announcements
Announcement under Regulation 30 (LODR)-Allotment of ESOP / ESPS
08-Jun-2026 | Source : BSEAllotment of 8753 equity shares by D. B. Corp Limited (the Company) under D. B. Corp Limited Employee Stock Option Scheme 2011 (DBCL ESOS - 2011 Scheme)
Announcement under Regulation 30 (LODR)-Analyst / Investor Meet - Intimation
22-May-2026 | Source : BSEIntimation of Schedule of Analysts/Investors Meet to be held on Friday May 29 2026
Announcement under Regulation 30 (LODR)-Earnings Call Transcript
14-May-2026 | Source : BSETranscript of the Conference Call for Investors and Analysts held on Monday May 11 2026
Corporate Actions

No Upcoming Board Meetings

D B Corp Ltd has declared 20% dividend, ex-date: 22 Jan 26

No Splits history available

No Bonus history available

No Rights history available
Quality key factors
Valuation key factors
Technicals key factors
 Technical Indicator Scale: Bearish, Mildly Bearish, Sideways, Mildly Bullish, Bullish Turned
 Shareholding Snapshot : Mar 2026
Shareholding Compare (%holding)
Promoters
None
Held by 3 Schemes (3.75%)
Held by 85 FIIs (12.05%)
Db Consolidated Private Limited (54.41%)
Nalanda India Equity Fund Limited (9.27%)
6.57%
Quarterly Results Snapshot (Consolidated) - Mar'26 - YoY

YoY Growth in quarter ended Mar 2026 is 5.25% vs -11.26% in Mar 2025
YoY Growth in quarter ended Mar 2026 is 18.84% vs -57.29% in Mar 2025
Half Yearly Results Snapshot (Consolidated) - Sep'25
Growth in half year ended Sep 2025 is 2.18% vs 0.75% in Sep 2024

Growth in half year ended Sep 2025 is -13.04% vs 11.97% in Sep 2024
Nine Monthly Results Snapshot (Consolidated) - Dec'25
YoY Growth in nine months ended Dec 2025 is -0.69% vs 0.36% in Dec 2024
YoY Growth in nine months ended Dec 2025 is -15.33% vs 5.17% in Dec 2024
Annual Results Snapshot (Consolidated) - Mar'26
YoY Growth in year ended Mar 2026 is 0.70% vs -2.62% in Mar 2025
YoY Growth in year ended Mar 2026 is -10.51% vs -12.82% in Mar 2025
About D B Corp Ltd

Company Coordinates


