
Compare Netwrk.18 Media with Similar Stocks
Dashboard
High Debt company with Weak Long Term Fundamental Strength
- Poor long term growth as Net Sales has grown by an annual rate of -15.76% and Operating profit at -163.20% over the last 5 years
- High Debt Company with a Debt to Equity ratio (avg) of 2.40 times
- The company has been able to generate a Return on Equity (avg) of 5.64% signifying low profitability per unit of shareholders funds
Negative results in Jun 26
Risky - Negative Operating Profits
Falling Participation by Institutional Investors
Stock DNA
Media & Entertainment
INR 4,476 Cr (Small Cap)
NA (Loss Making)
18
0.00%
0.64
0.70%
0.91
Total Returns (Price + Dividend) 
Latest dividend: 1.246428830265256 per share ex-dividend date: Feb-14-2008
Risk Adjusted Returns v/s
Returns Beta

News

Network 18 Media & Investments Ltd is Rated Strong Sell
Network 18 Media & Investments Ltd is rated Strong Sell by MarketsMOJO. This rating was last updated on 18 Apr 2024. However, the analysis and financial metrics discussed below reflect the company’s current position as of 28 July 2026, providing investors with an up-to-date view of the stock’s fundamentals, returns, and market standing.
Read full news article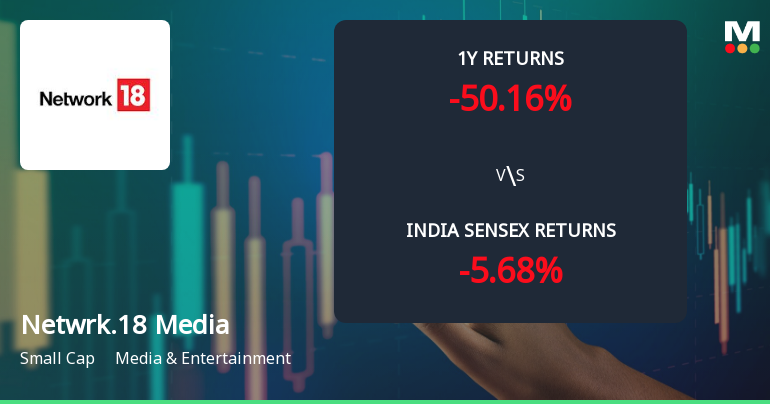
Network 18 Media & Investments Ltd: Technical Momentum Shifts Amid Prolonged Downtrend
Network 18 Media & Investments Ltd has exhibited a subtle shift in its technical momentum, moving from a bearish stance to a mildly bearish outlook, as reflected in recent technical indicators. Despite this slight improvement, the stock continues to face significant headwinds, with key metrics signalling ongoing challenges in reversing its prolonged downtrend.
Read full news article
Network 18 Media & Investments Ltd Faces Bearish Momentum Amid Technical Deterioration
Network 18 Media & Investments Ltd has experienced a notable shift in its technical momentum, with key indicators signalling a bearish trend. The stock’s recent price action, combined with mixed signals from MACD, RSI, and moving averages, paints a challenging outlook for investors amid a broader market context where the Sensex continues to outperform.
Read full news article Announcements
Announcement under Regulation 30 (LODR)-Press Release / Media Release
15-Jul-2026 | Source : BSERegulation 30 of the Securities and Exchange Board of India (Listing Obligations and Disclosure Requirement) Regulations 2015 - Investors Update
Board Meeting Outcome for Regulation 30 & 33 Of The Securities And Exchange Board Of India (Listing Obligations And Disclosure Requirements) Regulations 2015 - Outcome Of The Board Meeting
15-Jul-2026 | Source : BSEWe inform you that the Board of Directors of the Company at its meeting held today i.e. July 15 2026 has inter-alia approved the Unaudited Financial Results (Standalone and Consolidated) for the quarter ended June 30 2026. We enclose herewith the Unaudited Financial Results (Standalone and Consolidated) of the Company for the quarter ended June 30 2026 along with the Limited Review Reports of the Statutory Auditors. The Meeting of the Board of Directors commenced at 3:30 p.m. and concluded at 05:05 p.m. The Unaudited Financial Results (Standalone and Consolidated) for the quarter ended June 30 2026 as approved by the Board will also be available on the Companys website at https://www.nw18.com/network18/finance.
Unaudited Financial Results (Standalone And Consolidated) For The Quarter Ended June 30 2026
15-Jul-2026 | Source : BSEUnaudited Financial Results (Standalone and Consolidated) for the quarter ended June 30 2026
Corporate Actions

No Upcoming Board Meetings

Network 18 Media & Investments Ltd has declared 25% dividend, ex-date: 14 Feb 08

No Splits history available

No Bonus history available

Network 18 Media & Investments Ltd has announced 307:50 rights issue, ex-date: 11 Sep 12
Quality key factors
Valuation key factors
Technicals key factors
 Technical Indicator Scale: Bearish, Mildly Bearish, Sideways, Mildly Bullish, Bullish Turned
 Shareholding Snapshot : Jun 2026
Shareholding Compare (%holding)
Promoters
None
Held by 7 Schemes (0.12%)
Held by 83 FIIs (4.33%)
Rb Mediasoft Private Limited (9.25%)
Nexg Ventures India Pvt Ltd (4.63%)
25.19%
Quarterly Results Snapshot (Consolidated) - Jun'26 - YoY

YoY Growth in quarter ended Jun 2026 is 10.34% vs -85.10% in Jun 2025

YoY Growth in quarter ended Jun 2026 is -126.15% vs 218.05% in Jun 2025
Half Yearly Results Snapshot (Consolidated) - Sep'25
Growth in half year ended Sep 2025 is -80.55% vs -2.71% in Sep 2024
Growth in half year ended Sep 2025 is 185.30% vs -121.86% in Sep 2024
Nine Monthly Results Snapshot (Consolidated) - Dec'25
YoY Growth in nine months ended Dec 2025 is -76.21% vs -8.02% in Dec 2024
YoY Growth in nine months ended Dec 2025 is 111.03% vs -949.87% in Dec 2024
Annual Results Snapshot (Consolidated) - Mar'26
YoY Growth in year ended Mar 2026 is -69.21% vs -25.92% in Mar 2025
YoY Growth in year ended Mar 2026 is 109.02% vs -717.74% in Mar 2025
About Network 18 Media & Investments Ltd

Company Coordinates


