
Compare D B Corp with Similar Stocks
Dashboard
The company is Net-Debt Free
Poor long term growth as Net Sales has grown by an annual rate of 9.33% and Operating profit at 15.39% over the last 5 years
Flat results in Mar 26
With ROE of 13.7, it has a Very Attractive valuation with a 1.5 Price to Book Value
Majority shareholders : Promoters
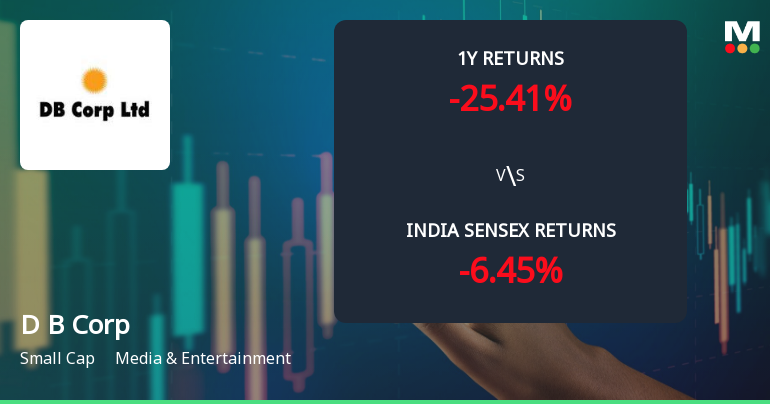
Underperformed the market in the last 1 year
With its market cap of Rs 3,617 cr, it is the biggest company in the sector and constitutes 24.45% of the entire sector
Stock DNA
Media & Entertainment
INR 3,635 Cr (Small Cap)
11.00
12
3.45%
-0.28
13.67%
1.49
Total Returns (Price + Dividend) 
Latest dividend: 1.9895084515251602 per share ex-dividend date: Jan-22-2026
Risk Adjusted Returns v/s
Returns Beta

News
D B Corp Ltd Technical Momentum Shifts Amid Mixed Market Signals
D B Corp Ltd, a small-cap player in the Media & Entertainment sector, has experienced a nuanced shift in its technical momentum, reflecting a complex interplay of bearish and mildly bullish signals. Despite a recent downgrade in price and a challenging year-to-date performance, technical indicators suggest a cautious outlook with pockets of potential recovery.
Read full news article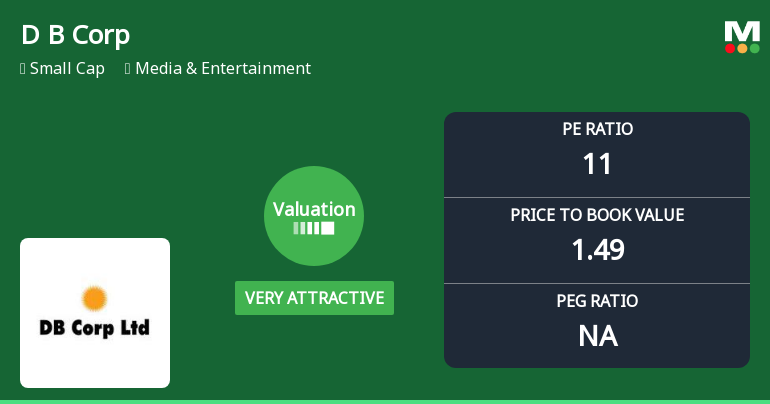
D B Corp Ltd Valuation Turns Very Attractive Amid Market Challenges
D B Corp Ltd has witnessed a significant improvement in its valuation parameters, shifting from an attractive to a very attractive rating. This change reflects a notable realignment in price-to-earnings and price-to-book value ratios, positioning the media and entertainment company as a compelling option within its sector despite recent market headwinds.
Read full news article
D B Corp Ltd Technical Analysis: Momentum Shifts Amid Bearish Trends
D B Corp Ltd, a small-cap player in the Media & Entertainment sector, has experienced a notable shift in its technical momentum, moving from a mildly bearish stance to a more pronounced bearish trend. Despite a modest day decline of 0.51%, the stock’s technical indicators reveal a complex interplay of signals that investors should carefully analyse amid broader market conditions.
Read full news article Announcements
Announcement under Regulation 30 (LODR)-Allotment of ESOP / ESPS
08-Jun-2026 | Source : BSEAllotment of 8753 equity shares by D. B. Corp Limited (the Company) under D. B. Corp Limited Employee Stock Option Scheme 2011 (DBCL ESOS - 2011 Scheme)
Announcement under Regulation 30 (LODR)-Analyst / Investor Meet - Intimation
22-May-2026 | Source : BSEIntimation of Schedule of Analysts/Investors Meet to be held on Friday May 29 2026
Announcement under Regulation 30 (LODR)-Earnings Call Transcript
14-May-2026 | Source : BSETranscript of the Conference Call for Investors and Analysts held on Monday May 11 2026
Corporate Actions

No Upcoming Board Meetings

D B Corp Ltd has declared 20% dividend, ex-date: 22 Jan 26

No Splits history available

No Bonus history available

No Rights history available
Quality key factors
Valuation key factors
Technicals key factors
 Technical Indicator Scale: Bearish, Mildly Bearish, Sideways, Mildly Bullish, Bullish Turned
 Shareholding Snapshot : Mar 2026
Shareholding Compare (%holding)
Promoters
None
Held by 3 Schemes (3.75%)
Held by 85 FIIs (12.05%)
Db Consolidated Private Limited (54.41%)
Nalanda India Equity Fund Limited (9.27%)
6.57%
Quarterly Results Snapshot (Consolidated) - Mar'26 - YoY

YoY Growth in quarter ended Mar 2026 is 5.25% vs -11.26% in Mar 2025
YoY Growth in quarter ended Mar 2026 is 18.84% vs -57.29% in Mar 2025
Half Yearly Results Snapshot (Consolidated) - Sep'25
Growth in half year ended Sep 2025 is 2.18% vs 0.75% in Sep 2024

Growth in half year ended Sep 2025 is -13.04% vs 11.97% in Sep 2024
Nine Monthly Results Snapshot (Consolidated) - Dec'25
YoY Growth in nine months ended Dec 2025 is -0.69% vs 0.36% in Dec 2024
YoY Growth in nine months ended Dec 2025 is -15.33% vs 5.17% in Dec 2024
Annual Results Snapshot (Consolidated) - Mar'26
YoY Growth in year ended Mar 2026 is 0.70% vs -2.62% in Mar 2025
YoY Growth in year ended Mar 2026 is -10.51% vs -12.82% in Mar 2025
About D B Corp Ltd

Company Coordinates


