D-Link India

  • Market Cap: Micro Cap
  • Industry: IT - Hardware
  • ISIN: INE250K01012
  • NSEID: DLINKINDIA
  • BSEID: 533146
INR
447.85
11.75 (2.69%)
BSENSE

Sep 02, 03:30 PM

BSE+NSE Vol: 4.34 lacs

  • Price Points
  • Score
  • Mojo Parameters
  • Total Return
  • News and Corporate Actions
  • Key factors
  • Shareholding
  • Financials
  • CompanyCV
stock-summaryPrice Point
High/Low

1Day

52 Week

Valuation
Technical
Day's Volume

CASH

4.34 lacs (232.56%) Volume

Shareholding (Jun 2026)

FII

1.36%

Held by 35 FIIs

DII

0.01%

Held by 0 DIIs

Promoter

51.02%

Why is D-Link India Ltd falling/rising?

02-Sep-2026

As of 01-Sep, D-Link India Ltd's stock price is declining, currently at 436.10, with a total decline of -1.27% over the last two days. The stock has underperformed against benchmarks, showing negative returns over various periods, and has seen reduced investor participation, indicating a lack of confidence in its valuation and prospects.

As of 01-Sep, D-Link India Ltd's stock price is falling, currently at 436.10, reflecting a decrease of 4.4 (-1.0%). The stock has been on a downward trend, having lost value for the last two consecutive days, resulting in a total decline of -1.27% during this period. <BR><BR>In terms of performance, the stock has underperformed compared to the benchmark Sensex, with a -2.94% return over the past week and a -3.35% return over the past month. Over the last year, the stock has generated a return of -8.99%, which is significantly lower than the -4.26% return of the benchmark. Additionally, the stock's performance has been below par in both the long term and near term, as it has underperformed the BSE500 index over the last three years, one year, and three months.<BR><BR>Investor participation has also declined, with delivery volume dropping by -25.96% against the five-day average, indicating reduced interest in trading the stock. Although the company is net-debt free and has a high dividend yield of 7.58%, these positive factors are overshadowed by the flat results reported on June 26, the lowest return on capital employed (ROCE) at 27.16%, and a low debtors turnover ratio of 3.53 times. Furthermore, the absence of domestic mutual fund investment, which stands at 0%, suggests a lack of confidence from institutional investors regarding the stock's valuation and business prospects.<BR><BR>Overall, the combination of declining stock performance, reduced investor participation, and negative financial indicators contributes to the current downward trend in D-Link India Ltd's stock price.

View full answer

Who are in the management team of D-Link India?

01-Sep-2026

The management team of D-Link India includes Chairman Hung Yi Kao, Managing Director & CEO Tushar Sighat, and several independent and non-executive directors: Rajaram Ajgaonkar, Satish Godbole, Mukesh Lulla, and Madhu Gadodia. This team combines executive leadership with independent oversight.

The management team of D-Link India includes the following individuals:<BR><BR>1. **Hung Yi Kao** - Chairman & Non-Executive Director<BR>2. **Tushar Sighat** - Managing Director & CEO<BR>3. **Rajaram Ajgaonkar** - Independent Non-Executive Director<BR>4. **Satish Godbole** - Independent Non-Executive Director<BR>5. **Mukesh Lulla** - Non-Executive Director<BR>6. **Madhu Gadodia** - Independent Non-Executive Director<BR><BR>This team brings a mix of executive leadership and independent oversight to the company.

View full answer

What does D-Link India do?

01-Sep-2026

D-Link India Ltd, a Micro Cap company in the IT-Hardware industry, reported net sales of 457 Cr and a net profit of 28 Cr for June 2026. The company, formerly Smartlink Network Systems, has a market cap of INR 1,563 Cr and key metrics include a P/E of 15.00 and a dividend yield of 7.57%.

Overview:<BR>D-Link India Ltd operates in the IT - Hardware industry and is categorized as a Micro Cap company.<BR><BR>History:<BR>D-Link India Ltd was initially incorporated as Smartlink Network Systems Limited in 2008. The company underwent a name change following a demerger of its marketing business effective April 1, 2008. The latest quarterly results report net sales and net profit for June 2026.<BR><BR>Financial Snapshot:<BR>Net Sales: 457 Cr (Quarterly Results - Jun 2026) <BR>Net Profit: 28 Cr (Quarterly Results - Jun 2026) <BR>Market Cap: INR 1,563 Cr (Micro Cap)<BR><BR>Key Metrics:<BR>P/E: 15.00 <BR>Industry P/E: 21 <BR>Dividend Yield: 7.57% <BR>Debt-Equity: -0.37 <BR>Return on Equity: 20.58% <BR>Price to Book: 3.11 <BR><BR>Contact Details:<BR>Address: Plot No U02B Verna Indl Estate, Verna Salcette Goa Goa : 403722 <BR>Tel: 91-832-2885800 <BR>Email: shares@dlink.co.in <BR>Website: http://www.dlink.co.in

View full answer

Who are the peers of the D-Link India?

01-Sep-2026

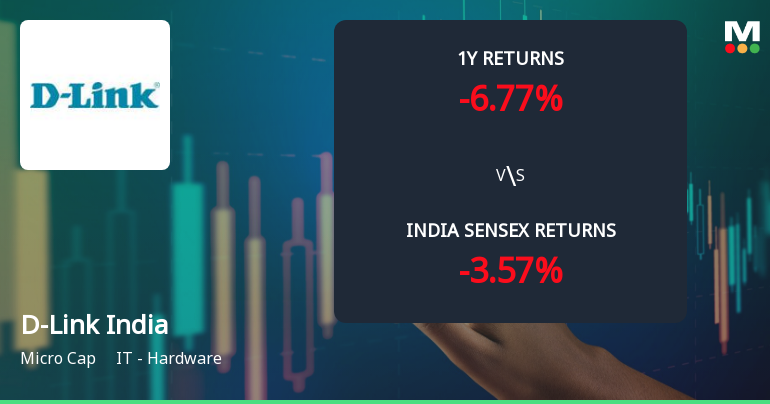
D-Link India's peers include Aditya Infotech, E2E Networks, GNG Electronics, Rashi Peripheral, NELCO, Bharat Global, Control Print, TVS Electronics, and DC Infotech. Aditya Infotech shows excellent growth and management risk, while D-Link India has average growth and management risk, with a 1-year return of -6.77%.

Peers: The peers of D-Link India are Aditya Infotech, E2E Networks, GNG Electronics, Rashi Peripheral, NELCO, Bharat Global, Control Print, TVS Elec., and DC Infotech.<BR><BR>Quality Snapshot: Excellent management risk is observed at Aditya Infotech and GNG Electronics, while Average management risk is found at E2E Networks, Rashi Peripheral, NELCO, D-Link India, Bharat Global, Control Print, TVS Elec., and DC Infotech. Growth is Excellent for Aditya Infotech, E2E Networks, GNG Electronics, Rashi Peripheral, and DC Infotech, while Average growth is seen at D-Link India, and Below Average growth is noted for NELCO, Bharat Global, Control Print, and TVS Elec. Excellent capital structure is present at Aditya Infotech, D-Link India, and Control Print, while Good capital structure is found at E2E Networks, NELCO, DC Infotech, and TVS Elec., and Average capital structure is noted for GNG Electronics, Rashi Peripheral, Bharat Global, and the rest.<BR><BR>Return Snapshot: The peer with the highest 1-year return is Aditya Infotech at 183.74%, while Bharat Global has the lowest at -5.42%. D-Link India's 1-year return is -6.77%, which is lower than Bharat Global's. Additionally, Control Print and Panache Digilife have negative six-month returns.

View full answer

How big is D-Link India?

01-Sep-2026

As of 31st August, D-Link India Ltd has a market capitalization of 1,563.00 Cr, with net sales of 1,672.50 Cr and a net profit of 107.29 Cr reported in the latest four quarters.

As of 31st August, D-Link India Ltd has a market capitalization of 1,563.00 Cr, categorizing it as a Micro Cap company.<BR><BR>In the latest four quarters, D-Link India reported net sales of 1,672.50 Cr and a net profit of 107.29 Cr.<BR><BR>The latest annual period for the balance sheet is March 2026, with shareholder's funds amounting to 505.69 Cr and total assets of 807.74 Cr.

View full answer

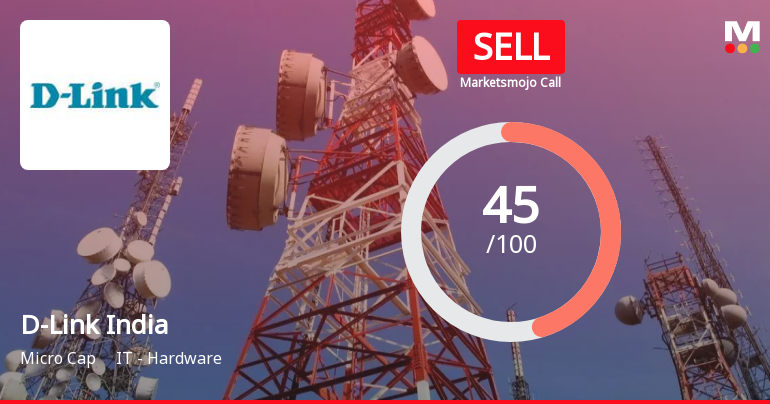
Should I buy, sell or hold D-Link India Ltd?

01-Sep-2026

Are D-Link India Ltd latest results good or bad?

02-Aug-2026

D-Link India Ltd's latest results show strong revenue growth with record quarterly sales of ₹456.96 crores, but profit stagnation and declining margins raise concerns about operational efficiency, leading to negative market reactions. Overall, while sales are impressive, the lack of profit growth suggests challenges ahead.

D-Link India Ltd's latest results present a mixed picture. On one hand, the company achieved its highest-ever quarterly sales of ₹456.96 crores in Q1 FY27, reflecting a robust year-on-year growth of 30.50%. This indicates strong demand in the IT hardware distribution sector. However, the profit growth has not kept pace with revenue, as net profit remained flat at ₹27.61 crores compared to the previous quarter, despite a year-on-year increase of 13.25%. <BR><BR>The operating margin has contracted from 7.90% in Q4 FY26 to 7.60% in Q1 FY27, which raises concerns about the company's ability to convert revenue growth into profit. This margin compression, alongside a decline in the PAT margin to 6.04%, suggests underlying operational challenges that investors are wary of.<BR><BR>The market's reaction has been negative, with the stock trading down 12.86% over the past month and currently sitting 17.81% below its 52-week high. While the company maintains a strong balance sheet with zero long-term debt and a solid return on equity of 20.58%, the operational metrics indicate that D-Link India is facing significant challenges in maintaining profitability amidst strong revenue growth.<BR><BR>In summary, while the revenue growth is impressive, the stagnation in profit and declining margins suggest that the results are not entirely favorable, leading to investor concerns about the company's operational efficiency and future profitability.

View full answer

Is D-Link India overvalued or undervalued?

17-Nov-2025

As of November 14, 2025, D-Link India is considered undervalued with a PE ratio of 15.61 and strong financial metrics, despite a year-to-date performance decline, making it an attractive investment compared to peers.

As of 14 November 2025, D-Link India has moved from a fair to an attractive valuation grade, indicating a positive shift in its perceived value. The company is currently considered undervalued, with a PE ratio of 15.61, an EV to EBIT of 11.37, and a robust ROCE of 52.32%. In comparison to peers, such as PTC India, which has a significantly lower PE ratio of 7.52, and Elitecon International, which is deemed very expensive with a PE ratio of 309.88, D-Link India presents a more favorable investment opportunity.<BR><BR>Despite a challenging year-to-date performance of -16.46% compared to the Sensex's 8.22%, D-Link India has shown resilience with a strong dividend yield of 4.61% and a solid ROE of 21.95%. This combination of attractive valuation metrics and strong operational performance suggests that D-Link India is well-positioned for future growth, reinforcing its undervalued status in the current market landscape.

View full answer

How has been the historical performance of D-Link India?

06-Nov-2025

D-Link India has shown consistent growth in net sales and profits, with net sales increasing from 726.55 crore in March 2021 to 1,383.86 crore in March 2025, and profit after tax rising from 31.35 crore to 104.26 crore during the same period. The company has demonstrated strong financial performance across various metrics, including improved operating profit and cash flow.

Answer:<BR>D-Link India's historical performance shows a consistent growth trajectory in net sales and profits over the years, with the latest figures for March 2025 indicating net sales of 1,383.86 crore and a profit after tax of 104.26 crore.<BR><BR>Breakdown:<BR>D-Link India's consolidated net sales have steadily increased from 726.55 crore in March 2021 to 1,383.86 crore in March 2025, reflecting a robust growth trend. The total operating income also rose significantly, reaching 1,383.86 crore in March 2025, up from 726.55 crore in March 2021. The operating profit, excluding other income, improved from 41.86 crore in March 2021 to 126.99 crore in March 2025, while the profit before tax increased from 42.40 crore to 139.68 crore in the same period. The profit after tax has shown a remarkable rise from 31.35 crore in March 2021 to 104.26 crore in March 2025, indicating enhanced profitability. Total assets have grown from 428.63 crore in March 2021 to 745.18 crore in March 2025, while total liabilities increased from 428.63 crore to 745.18 crore, suggesting a balanced growth in both assets and liabilities. Cash flow from operating activities has also improved, reaching 89 crore in March 2025 compared to 28 crore in March 2020, demonstrating better cash generation capabilities. Overall, D-Link India has exhibited strong financial performance and growth across various metrics over the years.

View full answer

Is D-Link India technically bullish or bearish?

31-Oct-2025

As of October 30, 2025, D-Link India is in a bearish trend, indicated by a bearish MACD, Bollinger Bands, and moving averages, along with significant underperformance against the Sensex over the past year.

As of 30 October 2025, the technical trend has changed from mildly bearish to bearish. The current technical stance for D-Link India is bearish with a strong indication of weakness. Key indicators driving this stance include a bearish MACD on the weekly chart, bearish Bollinger Bands on both weekly and monthly time frames, and bearish moving averages on the daily chart. The KST is also bearish on the weekly chart, while the Dow Theory shows no trend on the weekly but is mildly bearish on the monthly. The stock has underperformed significantly against the Sensex over the past year, further reinforcing the bearish outlook.

View full answer

Who are the top shareholders of the D-Link India?

17-Jul-2025

The top shareholders of D-Link India are D-Link Holding Mauritius Inc at 51.02%, followed by Mukesh Tirthdas Lulla with 6.18%, and individual investors who collectively own 34.66%. Additionally, 25 foreign institutional investors hold 1.2% of the company, with no mutual funds currently invested.

The top shareholders of D-Link India include D-Link Holding Mauritius Inc, which holds the largest share at 51.02%. Following that, the highest public shareholder is Mukesh Tirthdas Lulla, with a holding of 6.18%. Additionally, individual investors collectively own 34.66% of the shares. There are also 25 foreign institutional investors (FIIs) that hold a total of 1.2% of the company. Notably, there are no mutual funds currently holding shares in D-Link India.

View full answer

When is the next results date for D-Link India?

06-Jun-2025

No Upcoming Board Meetings

Has D-Link India declared dividend?

06-Jun-2025

Yes, D-Link India Ltd has declared a dividend of 250% (₹5 per share) with an ex-date of November 12, 2024. The company has shown strong total returns over the long term, despite recent short-term fluctuations.

D-Link India Ltd has declared a dividend.<BR><BR>Dividend Details:<BR>- Percentage announced: 250%<BR>- Amount per share: 5<BR>- Ex-date: 12 Nov 24<BR><BR>Dividend Yield: 3.72%<BR><BR>Total Returns by Period:<BR>In the last 6 months, the price return was -18.39%, with a dividend return of 0%, resulting in a total return of -18.39%.<BR><BR>Over the past year, the price return was 19.29%, the dividend return was 2.13%, leading to a total return of 21.42%.<BR><BR>In the last 2 years, the price return stood at 119.3%, with a dividend return of 6.51%, culminating in a total return of 125.81%.<BR><BR>For the 3-year period, the price return was 275.39%, the dividend return was 16.06%, resulting in a total return of 291.45%.<BR><BR>In the past 4 years, the price return reached 352.7%, with a dividend return of 14.44%, leading to a total return of 367.14%.<BR><BR>Over the last 5 years, the price return was 491.89%, with a dividend return of 24.72%, resulting in a total return of 516.61%.<BR><BR>Overall, D-Link India Ltd has declared a significant dividend, and the total returns over various periods indicate strong growth, particularly in the longer-term, despite some fluctuations in the short term.

View full answer
iScoreScore
Click here to find our call on this stock
Strong Sell
Sell
Hold
Buy
Strong Buy

Dashboard

1

Flat results in Jun 26

  • ROCE(HY) Lowest at 27.16%
  • DEBTORS TURNOVER RATIO(HY) Lowest at 3.53 times
2

Despite the size of the company, domestic mutual funds hold only 0% of the company

stock-summaryMojo Parameters

Mojo Parameters

Loading Valuation Snapshot...

Stock DNA

stock-summary
Industry

IT - Hardware

stock-summary
Market cap

INR 1,536 Cr (Micro Cap)

stock-summary
P/E

15.00

stock-summary
Industry P/E

22

stock-summary
Dividend Yield

7.65%

stock-summary
Debt Equity

-0.37

stock-summary
Return on Equity

20.58%

stock-summary
Price to Book

3.07

Revenue and Profits:
Net Sales:
457 Cr
(Quarterly Results - Jun 2026)
Net Profit:
28 Cr
stock-summaryTotal Returns
Total Returns (Price + Dividend) stock-summary
Dividend Yield (7.65%)
TimePeriod
Price Return
Dividend Return
Total Return
3 Months
-5.8%
1.56%
-4.24%
6 Months
10.38%
1.89%
12.27%
1 Year
-6.35%
2.73%
-3.62%
2 Years
-26.0%
4.95%
-21.05%
3 Years
37.21%
12.83%
50.04%
4 Years
137.21%
27.04%
164.25%
5 Years
236.22%
34.01%
270.23%

Latest dividend: 7.5 per share ex-dividend date: Jul-10-2026

Risk Adjusted Returns v/s stock-summary
Returns Beta
Icon
Beta has not been calculated since enough price history is not available
stock-summaryNews & Corporate Actions

News

D-Link India Gains 3.66%: Technical Shift and Valuation Support Drive Stability

Announcements stock-summary

D-Link (India) Limited - Other General Purpose

05-Dec-2019 | Source : NSE

D-Link (India) Limited has informed the Exchange regarding Submission Disclosure on Related Party Transactions

Shareholders meeting

03-Aug-2019 | Source : NSE

D-Link (India) Limited has submitted the Exchange a copy Srutinizers report of Annual General Meeting held on August 02, 2019. Further, the company has informed the Exchange regarding voting results.

Shareholders meeting

02-Aug-2019 | Source : NSE

D-Link (India) Limited has informed the Exchange regarding Proceedings of Annual General Meeting held on August 02, 2019

Corporate Actions stock-summary

stock-summary
BOARD MEETING

No Upcoming Board Meetings

stock-summary
DIVIDEND

D-Link India Ltd has declared 1000% dividend, ex-date: 10 Jul 26

stock-summary
SPLITS

No Splits history available

stock-summary
BONUS

No Bonus history available

stock-summary
RIGHTS

No Rights history available

stock-summaryKey Factors

Quality key factors stock-summary

Factor
Value
Sales Growth (5y)
16.97%
EBIT Growth (5y)
23.48%
EBIT to Interest (avg)
96.98
Debt to EBITDA (avg)
Net Debt is too low
Net Debt to Equity (avg)
-0.37
Sales to Capital Employed (avg)
2.98
Tax Ratio
25.72%
Dividend Payout Ratio
68.11%
Pledged Shares
0
Institutional Holding
1.36%
ROCE (avg)
41.62%
ROE (avg)
20.12%

Valuation key factors

Factor
Value
P/E Ratio
15
Industry P/E
22
Price to Book Value
3.15
EV to EBIT
10.80
EV to EBITDA
10.22
EV to Capital Employed
4.41
EV to Sales
0.84
PEG Ratio
6.89
Dividend Yield
7.47%
ROCE (Latest)
39.21%
ROE (Latest)
20.58%

Technicals key factors

Indicator
Weekly
Monthly
MACD
Bearish
Mildly Bearish
RSI
No Signal
No Signal
Bollinger Bands
Mildly Bearish
Mildly Bearish
Moving Averages
Mildly Bullish (Daily)
KST
Mildly Bearish
Bearish
Dow Theory
Mildly Bullish
No Trend
OBV
Bullish
No Trend
stock-summary Technical Indicator Scale: Bearish, Mildly Bearish, Sideways, Mildly Bullish, Bullish  Turned 
stock-summaryShareholding
Shareholding Snapshot : Jun 2026stock-summary
Shareholding Compare (%holding) stock-summary
Majority shareholders

Promoters

Pledged Promoter Holdings

None

Mutual Funds

Held by 0 Schemes

FIIs

Held by 35 FIIs (1.36%)

Promoter with highest holding

D-link Holding Mauritius Inc (51.02%)

Highest Public shareholder

Mukesh Tirthdas Lulla (5.48%)

Individual Investors Holdings

34.86%

stock-summaryFinancial
[
  {
    "link": "quarterly",
    "btn_text": "All Quarterly Results",
    "header": "Quarterly Results Snapshot (Consolidated) - Jun'26 - QoQ",
    "rhs": [
      {
        "prefix": "Net Sales ",
        "suffix": "QoQ Growth in quarter ended Jun 2026 is 2.99% vs 12.27% in Mar 2026",
        "dir": -1
      },
      {
        "prefix": "Consolidated Net Profit ",
        "suffix": "QoQ Growth in quarter ended Jun 2026 is 0.00% vs 3.45% in Mar 2026",
        "dir": -1
      }
    ],
    "table": {
      "header": [
        "Jun'26",
        "Mar'26",
        "Change(%)"
      ],
      "body": [
        {
          "field": "Net Sales",
          "val1": "456.96",
          "val2": "443.71",
          "chgp": "2.99%",
          "chgp_class": "positive"
        },
        {
          "field": "Operating Profit (PBDIT) excl Other Income",
          "val1": "34.75",
          "val2": "35.05",
          "chgp": "-0.86%",
          "chgp_class": "negative"
        },
        {
          "field": "Interest",
          "val1": "0.38",
          "val2": "0.30",
          "chgp": "26.67%",
          "chgp_class": "negative"
        },
        {
          "field": "Exceptional Items",
          "val1": "0.00",
          "val2": "0.00",
          "chgp": "",
          "chgp_class": "neutral"
        },
        {
          "field": "Consolidate Net Profit",
          "val1": "27.61",
          "val2": "27.61",
          "chgp": "",
          "chgp_class": "neutral"
        },
        {
          "field": "Operating Profit Margin (Excl OI)",
          "val1": "7.60%",
          "val2": "7.90%",
          "chgp": "-0.30%",
          "chgp_class": "negative"
        }
      ]
    }
  },
  {
    "link": "half-yearly",
    "btn_text": "All Half Yearly Results",
    "header": "Half Yearly Results Snapshot (Consolidated) - Sep'25",
    "rhs": [
      {
        "prefix": "Net Sales ",
        "suffix": " Growth in half year ended Sep 2025 is 6.46% vs 12.32% in Sep 2024",
        "dir": -1
      },
      {
        "prefix": "Consolidated Net Profit ",
        "suffix": " Growth in half year ended Sep 2025 is -1.15% vs 12.90% in Sep 2024",
        "dir": -1
      }
    ],
    "table": {
      "header": [
        "Sep'25",
        "Sep'24",
        "Change(%)"
      ],
      "body": [
        {
          "field": "Net Sales",
          "val1": "726.78",
          "val2": "682.71",
          "chgp": "6.46%",
          "chgp_class": "positive"
        },
        {
          "field": "Operating Profit (PBDIT) excl Other Income",
          "val1": "62.32",
          "val2": "61.16",
          "chgp": "1.90%",
          "chgp_class": "positive"
        },
        {
          "field": "Interest",
          "val1": "0.71",
          "val2": "0.46",
          "chgp": "54.35%",
          "chgp_class": "negative"
        },
        {
          "field": "Exceptional Items",
          "val1": "0.00",
          "val2": "0.00",
          "chgp": "",
          "chgp_class": "neutral"
        },
        {
          "field": "Consolidate Net Profit",
          "val1": "49.75",
          "val2": "50.33",
          "chgp": "-1.15%",
          "chgp_class": "negative"
        },
        {
          "field": "Operating Profit Margin (Excl OI)",
          "val1": "8.57%",
          "val2": "8.96%",
          "chgp": "-0.39%",
          "chgp_class": "negative"
        }
      ]
    }
  },
  {
    "link": "nine-monthly",
    "btn_text": "All Nine Monthly Results",
    "header": "Nine Monthly Results Snapshot (Consolidated) - Dec'25",
    "rhs": [
      {
        "prefix": "Net Sales ",
        "suffix": "YoY Growth in nine months ended Dec 2025 is 10.64% vs 12.45% in Dec 2024",
        "dir": -1
      },
      {
        "prefix": "Consolidated Net Profit ",
        "suffix": "YoY Growth in nine months ended Dec 2025 is -0.51% vs 13.77% in Dec 2024",
        "dir": -1
      }
    ],
    "table": {
      "header": [
        "Dec'25",
        "Dec'24",
        "Change(%)"
      ],
      "body": [
        {
          "field": "Net Sales",
          "val1": "1,121.99",
          "val2": "1,014.11",
          "chgp": "10.64%",
          "chgp_class": "positive"
        },
        {
          "field": "Operating Profit (PBDIT) excl Other Income",
          "val1": "96.87",
          "val2": "94.55",
          "chgp": "2.45%",
          "chgp_class": "positive"
        },
        {
          "field": "Interest",
          "val1": "1.03",
          "val2": "0.63",
          "chgp": "63.49%",
          "chgp_class": "negative"
        },
        {
          "field": "Exceptional Items",
          "val1": "0.00",
          "val2": "0.00",
          "chgp": "",
          "chgp_class": "neutral"
        },
        {
          "field": "Consolidate Net Profit",
          "val1": "76.44",
          "val2": "76.83",
          "chgp": "-0.51%",
          "chgp_class": "negative"
        },
        {
          "field": "Operating Profit Margin (Excl OI)",
          "val1": "8.63%",
          "val2": "9.32%",
          "chgp": "-0.69%",
          "chgp_class": "negative"
        }
      ]
    }
  },
  {
    "link": "annual",
    "btn_text": "All Annual Results",
    "header": "Annual Results Snapshot (Consolidated) - Mar'26",
    "rhs": [
      {
        "prefix": "Net Sales ",
        "suffix": "YoY Growth in year ended Mar 2026 is 13.14% vs 11.99% in Mar 2025",
        "dir": 1
      },
      {
        "prefix": "Consolidated Net Profit ",
        "suffix": "YoY Growth in year ended Mar 2026 is -0.19% vs 12.56% in Mar 2025",
        "dir": -1
      }
    ],
    "table": {
      "header": [
        "Mar'26",
        "Mar'25",
        "Change(%)"
      ],
      "body": [
        {
          "field": "Net Sales",
          "val1": "1,565.70",
          "val2": "1,383.86",
          "chgp": "13.14%",
          "chgp_class": "positive"
        },
        {
          "field": "Operating Profit (PBDIT) excl Other Income",
          "val1": "131.91",
          "val2": "126.99",
          "chgp": "3.87%",
          "chgp_class": "positive"
        },
        {
          "field": "Interest",
          "val1": "1.33",
          "val2": "0.75",
          "chgp": "77.33%",
          "chgp_class": "negative"
        },
        {
          "field": "Exceptional Items",
          "val1": "0.00",
          "val2": "0.00",
          "chgp": "",
          "chgp_class": "neutral"
        },
        {
          "field": "Consolidate Net Profit",
          "val1": "104.06",
          "val2": "104.26",
          "chgp": "-0.19%",
          "chgp_class": "negative"
        },
        {
          "field": "Operating Profit Margin (Excl OI)",
          "val1": "8.42%",
          "val2": "9.18%",
          "chgp": "-0.76%",
          "chgp_class": "negative"
        }
      ]
    }
  }
]

Quarterly Results Snapshot (Consolidated) - Jun'26 - QoQstock-summary

Jun'26
Mar'26
Change(%)
Net Sales
456.96
443.71
2.99%
Operating Profit (PBDIT) excl Other Income
34.75
35.05
-0.86%
Interest
0.38
0.30
26.67%
Exceptional Items
0.00
0.00
Consolidate Net Profit
27.61
27.61
Operating Profit Margin (Excl OI)
7.60%
7.90%
-0.30%
Values in Rs Cr.
Direction Arrows
Net Sales

QoQ Growth in quarter ended Jun 2026 is 2.99% vs 12.27% in Mar 2026

Direction Arrows
Consolidated Net Profit

QoQ Growth in quarter ended Jun 2026 is 0.00% vs 3.45% in Mar 2026

Half Yearly Results Snapshot (Consolidated) - Sep'25stock-summary

Sep'25
Sep'24
Change(%)
Net Sales
726.78
682.71
6.46%
Operating Profit (PBDIT) excl Other Income
62.32
61.16
1.90%
Interest
0.71
0.46
54.35%
Exceptional Items
0.00
0.00
Consolidate Net Profit
49.75
50.33
-1.15%
Operating Profit Margin (Excl OI)
8.57%
8.96%
-0.39%
Values in Rs Cr.
Direction Arrows
Net Sales

Growth in half year ended Sep 2025 is 6.46% vs 12.32% in Sep 2024

Direction Arrows
Consolidated Net Profit

Growth in half year ended Sep 2025 is -1.15% vs 12.90% in Sep 2024

Nine Monthly Results Snapshot (Consolidated) - Dec'25stock-summary

Dec'25
Dec'24
Change(%)
Net Sales
1,121.99
1,014.11
10.64%
Operating Profit (PBDIT) excl Other Income
96.87
94.55
2.45%
Interest
1.03
0.63
63.49%
Exceptional Items
0.00
0.00
Consolidate Net Profit
76.44
76.83
-0.51%
Operating Profit Margin (Excl OI)
8.63%
9.32%
-0.69%
Values in Rs Cr.
Direction Arrows
Net Sales

YoY Growth in nine months ended Dec 2025 is 10.64% vs 12.45% in Dec 2024

Direction Arrows
Consolidated Net Profit

YoY Growth in nine months ended Dec 2025 is -0.51% vs 13.77% in Dec 2024

Annual Results Snapshot (Consolidated) - Mar'26stock-summary

Mar'26
Mar'25
Change(%)
Net Sales
1,565.70
1,383.86
13.14%
Operating Profit (PBDIT) excl Other Income
131.91
126.99
3.87%
Interest
1.33
0.75
77.33%
Exceptional Items
0.00
0.00
Consolidate Net Profit
104.06
104.26
-0.19%
Operating Profit Margin (Excl OI)
8.42%
9.18%
-0.76%
Values in Rs Cr.
Direction Arrows
Net Sales

YoY Growth in year ended Mar 2026 is 13.14% vs 11.99% in Mar 2025

Direction Arrows
Consolidated Net Profit

YoY Growth in year ended Mar 2026 is -0.19% vs 12.56% in Mar 2025

stock-summaryCompany CV
About D-Link India Ltd stock-summary
stock-summary
D-Link India Ltd
Micro Cap
IT - Hardware
D-Link (India) Limited was initially incorporated as Smartlink Network Systems Limited on May 26,2008. As per Scheme of Arrangement between the erstwhile Company, Smartlink Network Systems Limited, and their respective shareholders and creditors for Demerger of the Marketing Business of erstwhile Company in favor of Smartlink Network Systems Limited with effect from April 1, 2008. The name of the Company was changed from Smartlink Network Systems Limited to D-Link (India) Limited.
Company Coordinates stock-summary
Company Details
Plot No U02B Verna Indl Estate, Verna Salcette Goa Goa : 403722
stock-summary
Tel: 91-832-2885800
stock-summary
shares@dlink.co.in
Registrar Details
Karvy Computershare Pvt Ltd, Plot No 17-24 , Near Image Hospital,, Reliance Cybervilae,Vithalrao Nagar,, Madhapur, Hyderabad