
Compare D-Link India with Similar Stocks
Dashboard
The company is Net-Debt Free
Healthy long term growth as Operating profit has grown by an annual rate 27.93%
Flat results in Mar 26
With ROE of 20.6, it has a Very Attractive valuation with a 3.5 Price to Book Value
Despite the size of the company, domestic mutual funds hold only 0% of the company
Stock DNA
IT - Hardware
INR 1,778 Cr (Small Cap)
17.00
21
4.26%
-0.37
20.58%
3.46
Total Returns (Price + Dividend) 
Latest dividend: 6 per share ex-dividend date: Nov-14-2025
Risk Adjusted Returns v/s
Returns Beta

News
D-Link India Ltd Upgraded to Hold as Technicals and Valuation Improve
D-Link India Ltd has seen its investment rating upgraded from Sell to Hold, reflecting a notable improvement in technical indicators and valuation metrics despite flat recent financial performance. The company’s strong long-term growth, net debt-free status, and attractive dividend yield underpin this revised stance, while mixed financial trends and cautious institutional interest temper enthusiasm.
Read full news article
D-Link India Ltd Technical Momentum Shifts Amid Mixed Indicator Signals
D-Link India Ltd has experienced a notable shift in its technical momentum, moving from a sideways trend to a mildly bullish stance, despite a recent downgrade in its Mojo Grade from Hold to Sell. The stock’s mixed signals across key technical indicators such as MACD, RSI, and moving averages suggest a complex outlook for investors navigating the IT hardware sector.
Read full news article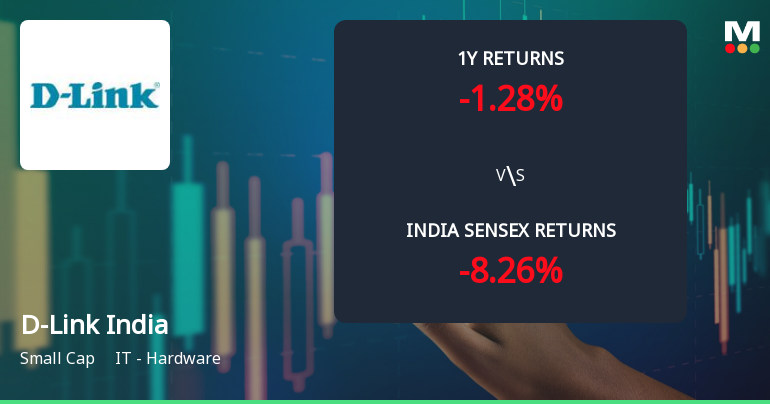
D-Link India Ltd Technical Momentum Shifts Amid Mixed Indicator Signals
D-Link India Ltd has experienced a notable shift in its technical momentum, moving from a mildly bearish stance to a more sideways trend, reflecting a complex interplay of bullish and bearish signals across key indicators. Despite a recent upgrade in technical trend, the stock remains rated as a Sell with a Mojo Score of 45.0, underscoring cautious investor sentiment amid mixed market signals.
Read full news article Announcements
Announcement under Regulation 30 (LODR)-Newspaper Publication
04-Jun-2026 | Source : BSENewspaper Publication
Compliances-Reg.24(A)-Annual Secretarial Compliance
22-May-2026 | Source : BSEAnnual Secretarial Compliance Report March 31 2026
Announcement under Regulation 30 (LODR)-Newspaper Publication
11-May-2026 | Source : BSECopy of Newspaper Publication
Corporate Actions

No Upcoming Board Meetings

D-Link India Ltd has declared 1000% dividend, ex-date: 10 Jul 26

No Splits history available

No Bonus history available

No Rights history available
Quality key factors
Valuation key factors
Technicals key factors
 Technical Indicator Scale: Bearish, Mildly Bearish, Sideways, Mildly Bullish, Bullish Turned
 Shareholding Snapshot : Mar 2026
Shareholding Compare (%holding)
Promoters
None
Held by 0 Schemes
Held by 30 FIIs (1.26%)
D-link Holding Mauritius Inc (51.02%)
Mukesh Tirthdas Lulla (5.76%)
34.76%
Quarterly Results Snapshot (Consolidated) - Mar'26 - QoQ

QoQ Growth in quarter ended Mar 2026 is 12.27% vs 4.94% in Dec 2025

QoQ Growth in quarter ended Mar 2026 is 3.45% vs 5.16% in Dec 2025
Half Yearly Results Snapshot (Consolidated) - Sep'25
Growth in half year ended Sep 2025 is 6.46% vs 12.32% in Sep 2024
Growth in half year ended Sep 2025 is -1.15% vs 12.90% in Sep 2024
Nine Monthly Results Snapshot (Consolidated) - Dec'25
YoY Growth in nine months ended Dec 2025 is 10.64% vs 12.45% in Dec 2024
YoY Growth in nine months ended Dec 2025 is -0.51% vs 13.77% in Dec 2024
Annual Results Snapshot (Consolidated) - Mar'26
YoY Growth in year ended Mar 2026 is 13.14% vs 11.99% in Mar 2025
YoY Growth in year ended Mar 2026 is -0.19% vs 12.56% in Mar 2025
About D-Link India Ltd

Company Coordinates


