
Compare D P Wires with Similar Stocks
Stock DNA
Iron & Steel Products
INR 270 Cr (Micro Cap)
15.00
26
0.00%
-0.04
6.94%
1.07
Total Returns (Price + Dividend) 
Latest dividend: 1.2 per share ex-dividend date: Sep-22-2023
Risk Adjusted Returns v/s
Returns Beta

News

D P Wires Ltd is Rated Sell by MarketsMOJO
D P Wires Ltd is rated 'Sell' by MarketsMOJO, with this rating last updated on 8 June 2026. However, the analysis and financial metrics discussed here reflect the stock’s current position as of 11 June 2026, providing investors with the most up-to-date view of the company’s fundamentals, returns, and market performance.
Read full news article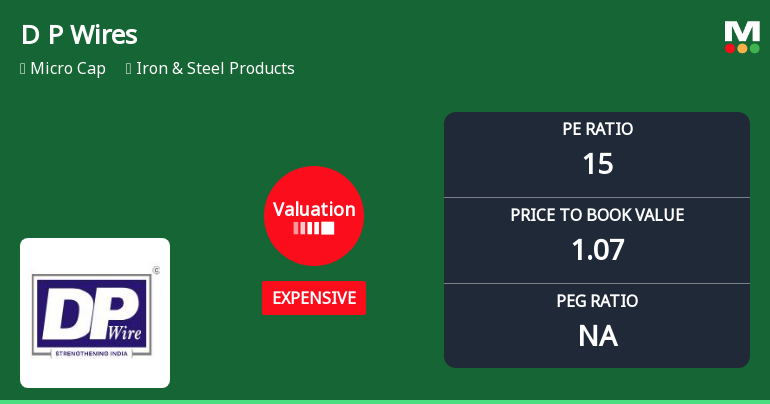
D P Wires Ltd Valuation Shifts to Expensive Amidst Sector Challenges
D P Wires Ltd, a micro-cap player in the Iron & Steel Products sector, has seen its valuation metrics shift from fair to expensive, prompting a downgrade in its Mojo Grade from Hold to Sell as of 8 June 2026. This change reflects growing concerns over the company’s price attractiveness relative to its historical averages and peer group, despite a challenging market backdrop and subdued returns over the past year.
Read full news article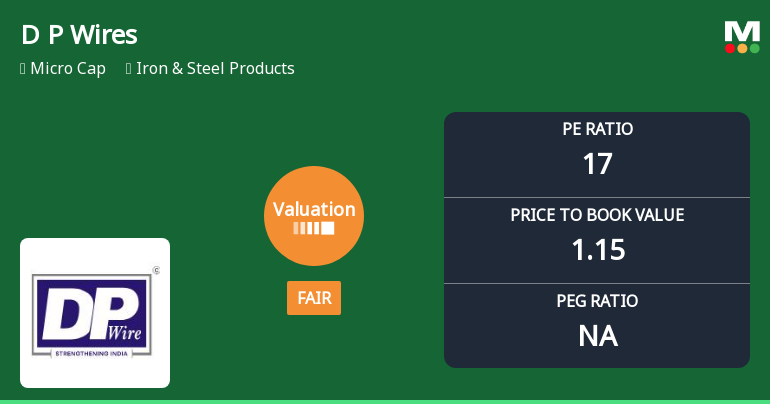
D P Wires Ltd Valuation Shifts to Fair Territory Amid Market Volatility
D P Wires Ltd has witnessed a notable improvement in its valuation parameters, transitioning from a previously expensive rating to a fair valuation status. This shift, underpinned by a price-to-earnings (P/E) ratio of 16.59 and a price-to-book value (P/BV) of 1.15, marks a significant change in the stock’s price attractiveness relative to its historical levels and peer group within the iron and steel products sector.
Read full news article Announcements
UPDATES
01-Jun-2026 | Source : BSEUPDATES
Announcement under Regulation 30 (LODR)-Newspaper Publication
01-Jun-2026 | Source : BSENEWSPAPER PUBLICATION QT4 2526
Board Meeting Outcome for Audited Financial Results For The Quarter Ended 31St March 2026 With Other Business Matters
30-May-2026 | Source : BSEAudited Financial Results For The Quarter Ended 31St March 2026 with other business matters
Corporate Actions

No Upcoming Board Meetings

D P Wires Ltd has declared 12% dividend, ex-date: 22 Sep 23

No Splits history available

D P Wires Ltd has announced 1:7 bonus issue, ex-date: 08 Nov 23

No Rights history available
Quality key factors
Valuation key factors
Technicals key factors
 Technical Indicator Scale: Bearish, Mildly Bearish, Sideways, Mildly Bullish, Bullish Turned
 Shareholding Snapshot : Mar 2026
Shareholding Compare (%holding)
Promoters
None
Held by 0 Schemes
Held by 2 FIIs (0.01%)
None
Amitabh Harivansh Rai Bachchan (2.11%)
22.66%
Quarterly Results Snapshot (Standalone) - Mar'26 - YoY

YoY Growth in quarter ended Mar 2026 is -6.28% vs -33.99% in Mar 2025
YoY Growth in quarter ended Mar 2026 is 132.43% vs -58.86% in Mar 2025
Half Yearly Results Snapshot (Standalone) - Sep'25
Growth in half year ended Sep 2025 is -22.02% vs -39.07% in Sep 2024

Growth in half year ended Sep 2025 is -63.74% vs -34.51% in Sep 2024
Nine Monthly Results Snapshot (Standalone) - Dec'25
YoY Growth in nine months ended Dec 2025 is -27.25% vs -39.08% in Dec 2024
YoY Growth in nine months ended Dec 2025 is -54.98% vs -31.41% in Dec 2024
Annual Results Snapshot (Standalone) - Mar'26
YoY Growth in year ended Mar 2026 is -22.59% vs -38.11% in Mar 2025
YoY Growth in year ended Mar 2026 is -20.81% vs -38.88% in Mar 2025
About D P Wires Ltd

Company Coordinates


