
Compare Dabur India with Similar Stocks
Dashboard
Poor long term growth as Net Sales has grown by an annual rate of 6.65% and Operating profit at 2.38% over the last 5 years
- PBT LESS OI(Q) At Rs 298.65 cr has Fallen at -33.9% (vs previous 4Q average)
- PAT(Q) At Rs 368.60 cr has Fallen at -20.7% (vs previous 4Q average)
- NET SALES(Q) At Rs 3,038.02 cr has Fallen at -6.4% (vs previous 4Q average)
Consistent Underperformance against the benchmark over the last 3 years
Total Returns (Price + Dividend) 
Latest dividend: 2.753981275938616 per share ex-dividend date: Nov-07-2025
Risk Adjusted Returns v/s
Returns Beta

News

Dabur India Ltd Sees Significant Open Interest Surge Amid Mixed Market Signals
Dabur India Ltd., a mid-cap FMCG player with a market capitalisation of ₹75,615 crores, has witnessed a notable 10.79% surge in open interest (OI) in its derivatives segment, signalling heightened market activity and shifting investor positioning. Despite a modest 0.05% price gain on 25 June 2026, the stock underperformed its sector by 0.54%, reflecting a complex interplay between volume dynamics and broader market trends.
Read full news article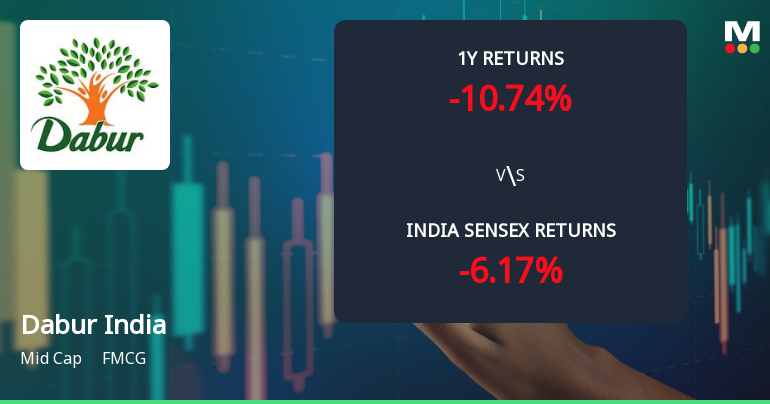
Dabur India Ltd. Technical Momentum Shifts Signal Bearish Outlook Amid Market Underperformance
Dabur India Ltd., a prominent player in the FMCG sector, has experienced a notable shift in its technical momentum, with key indicators signalling a transition from mildly bearish to a more pronounced bearish trend. Despite a modest 1.00% gain in the latest session, the stock faces mounting pressure from multiple technical parameters, raising concerns about its near-term trajectory amid broader market dynamics.
Read full news article
Dabur India Sees Significant Open Interest Surge Amid Mixed Market Signals
Dabur India Ltd., a mid-cap FMCG player, has witnessed a notable 13.15% surge in open interest (OI) in its derivatives segment, signalling heightened market activity and shifting investor positioning. Despite trading close to its 52-week low, the stock outperformed its sector and reversed a five-day losing streak, raising questions about the underlying directional bets and market sentiment.
Read full news article Announcements
Announcement under Regulation 30 (LODR)-Newspaper Publication
23-Jun-2026 | Source : BSENewspaper publication regarding Annual General Meeting (AGM) and Book Closure
Board Meeting Intimation for Considering Unaudited Financial Results For The Quarter Ending On 30Th June 2026.
23-Jun-2026 | Source : BSEDabur India Ltdhas informed BSE that the meeting of the Board of Directors of the Company is scheduled on 29/07/2026 inter alia to consider and approve the Unaudited Financial Results of the Company for the quarter ending on June 30 2026.
Closure of Trading Window
23-Jun-2026 | Source : BSEPursuant to requirements of SEBI (PIT) Regulations 2015 as amended from time to time and Code of Conduct for prevention of Insider Trading the Trading window for trading in the securities of the Company shall remain closed from Wednesday July 01 2026 to Friday July 31 2026 (both days inclusive)
Corporate Actions

29 Jul 2026

Dabur India Ltd. has declared 550% dividend, ex-date: 17 Jul 26

No Splits history available

Dabur India Ltd. has announced 1:1 bonus issue, ex-date: 08 Sep 10

No Rights history available
Quality key factors
Valuation key factors
Technicals key factors
 Technical Indicator Scale: Bearish, Mildly Bearish, Sideways, Mildly Bullish, Bullish Turned
 Shareholding Snapshot : Mar 2026
Shareholding Compare (%holding)
Promoters
None
Held by 35 Schemes (7.1%)
Held by 657 FIIs (9.98%)
Vic Enterprises Pvt Ltd (12.28%)
Life Insurance Corporation Of India - Ulif00320091 (8.57%)
4.13%
Quarterly Results Snapshot (Consolidated) - Mar'26 - QoQ

QoQ Growth in quarter ended Mar 2026 is -14.63% vs 11.51% in Dec 2025
QoQ Growth in quarter ended Mar 2026 is -34.18% vs 23.74% in Dec 2025
Half Yearly Results Snapshot (Consolidated) - Sep'25

Growth in half year ended Sep 2025 is 3.42% vs 0.68% in Sep 2024
Growth in half year ended Sep 2025 is 4.47% vs -5.50% in Sep 2024
Nine Monthly Results Snapshot (Consolidated) - Dec'25
YoY Growth in nine months ended Dec 2025 is 4.33% vs 1.50% in Dec 2024
YoY Growth in nine months ended Dec 2025 is 5.45% vs -3.06% in Dec 2024
Annual Results Snapshot (Consolidated) - Mar'26
YoY Growth in year ended Mar 2026 is 5.01% vs 1.28% in Mar 2025
YoY Growth in year ended Mar 2026 is 7.21% vs -4.07% in Mar 2025
About Dabur India Ltd.

Company Coordinates


