Dalmia BharatLtd

  • Market Cap: Mid Cap
  • Industry: Cement & Cement Products
  • ISIN: INE00R701025
  • NSEID: DALBHARAT
  • BSEID: 542216
INR
1,763.65
-2.05 (-0.12%)
BSENSE

Sep 21, 03:30 PM

BSE+NSE Vol: 1.27 lacs

  • Price Points
  • Score
  • Mojo Parameters
  • Total Return
  • News and Corporate Actions
  • Key factors
  • Shareholding
  • Financials
  • CompanyCV
stock-summaryPrice Point
High/Low

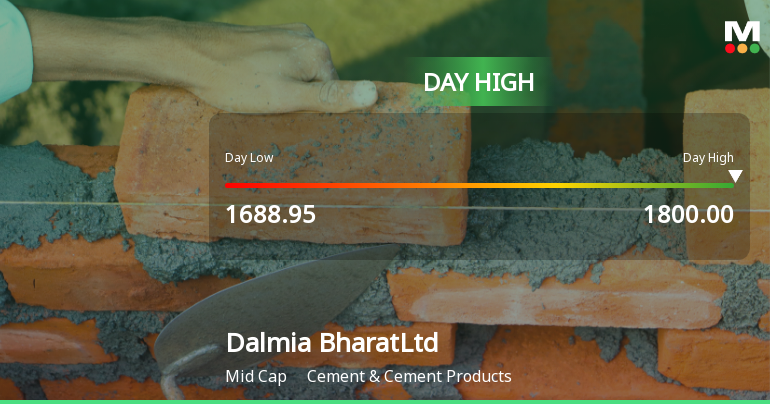
1Day

52 Week

Valuation
Technical
Day's Volume

CASH

1.27 lacs (-5.51%) Volume

Shareholding (Jun 2026)

FII

6.81%

Held by 139 FIIs

DII

20.08%

Held by 36 DIIs

Promoter

55.84%

Why is Dalmia Bharat Ltd falling/rising?

06-Sep-2026

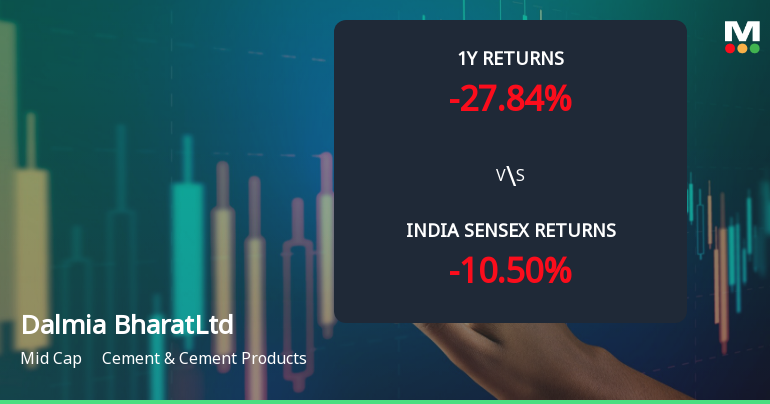
As of 05-Sep, Dalmia Bharat Ltd's stock price is declining, currently at 1,748.75, with a year-to-date decrease of 18.00% and underperformance compared to the Sensex. Factors contributing to this decline include low investor participation, poor long-term growth indicators, and a bearish trend across all moving averages.

As of 05-Sep, Dalmia Bharat Ltd's stock price is falling, currently at 1,748.75, reflecting a decrease of 21.85 points or 1.23%. This decline is evident in the stock's performance over various periods, including a 5.25% drop over the past week and an 18.00% decrease year-to-date. Additionally, the stock has underperformed compared to the Sensex, which has only seen a 0.97% decline over the same week and a 10.21% drop year-to-date.<BR><BR>The stock's performance today has also been below that of its sector, underperforming by 1.98%. Furthermore, Dalmia Bharat Ltd is trading lower than its moving averages across all time frames, including the 5-day, 20-day, 50-day, 100-day, and 200-day averages, indicating a bearish trend. A significant factor contributing to the stock's decline is the falling investor participation, as evidenced by a delivery volume of 28.41k on September 3, which has plummeted by 91.2% compared to the 5-day average.<BR><BR>While the company has a relatively low debt-to-equity ratio of 0.05 and has seen a profit increase of 19.6% over the past year, these positive aspects are overshadowed by poor long-term growth indicators. The net sales growth has been only 6.64% annually over the last five years, and the operating profit growth is nearly stagnant at 0.04%. Additionally, the company's recent quarterly results have shown flat performance, with a significant drop in profit before tax and the highest debt-equity ratio recorded at 0.41 times.<BR><BR>Overall, the combination of underperformance in both short-term and long-term metrics, declining investor interest, and poor growth prospects are key reasons for the falling stock price of Dalmia Bharat Ltd.

View full answer

Who are in the management team of Dalmia BharatLtd?

01-Sep-2026

The management team of Dalmia Bharat Ltd includes Pradip Kumar Khaitan (Chairman), Gautam Dalmia and Puneet Yadu Dalmia (Managing Directors), along with several independent directors and a company secretary, all of whom guide the company's strategy and operations.

The management team of Dalmia Bharat Ltd includes the following key individuals:<BR><BR>1. **Pradip Kumar Khaitan** - Chairman & Independent Director<BR>2. **Gautam Dalmia** - Managing Director<BR>3. **Puneet Yadu Dalmia** - Managing Director & CEO<BR>4. **Sudha Pillai** - Independent Director<BR>5. **Niddodi Subrao Rajan** - Director<BR>6. **Yadu Hari Dalmia** - Director<BR>7. **V S Jain** - Independent Director<BR>8. **Rajeev Kumar** - Company Secretary & Compliance Officer<BR>9. **Paul Hugentobler** - Independent Director<BR>10. **Anuradha Mookerjee** - Independent Director<BR><BR>This team plays a crucial role in guiding the company's strategy and operations.

View full answer

What does Dalmia BharatLtd do?

01-Sep-2026

Dalmia Bharat Ltd is a mid-cap cement producer established in 1939, with a market cap of INR 33,895 Cr and reported net sales of 3,890 Cr and net profit of 188 Cr for June 2026. Key metrics include a P/E ratio of 32.00 and a dividend yield of 0.49%.

Overview: <BR>Dalmia Bharat Ltd is a leading producer in the cement industry, categorized as a Mid Cap company.<BR><BR>History: <BR>Dalmia Bharat Ltd was established in 1939 by Shri Jaidayal Dalmia. The company has reported its latest quarterly results for June 2026, with net sales and profit figures available.<BR><BR>Financial Snapshot: <BR>Net Sales: 3,890 Cr (Quarterly Results - Jun 2026) <BR>Net Profit: 188 Cr (Quarterly Results - Jun 2026) <BR>Market Cap: INR 33,895 Cr (Mid Cap)<BR><BR>Key Metrics: <BR>P/E: 32.00 <BR>Industry P/E: 33 <BR>Dividend Yield: 0.49% <BR>Debt-Equity: 0.12 <BR>Return on Equity: 6.45% <BR>Price to Book: 1.92<BR><BR>Contact Details: <BR>Address: Dalmiapuram Lalgudi, Tiruchirapalli Tamil Nadu: 621651 <BR>Tel: 91-4329-235132 <BR>Email: corp.sec@dalmiabharat.com <BR>Website: http://www.dalmiabharat.com

View full answer

Who are the peers of the Dalmia BharatLtd?

01-Sep-2026

Dalmia Bharat Ltd's peers include UltraTech Cement, Grasim Industries, Ambuja Cements, Shree Cement, J K Cements, ACC, The Ramco Cement, JSW Cement, Nuvoco Vistas, and India Cements. Grasim Industries shows the highest 1-year return at 19.69%, while Dalmia Bharat Ltd has a return of -23.08%.

Peers: The peers of Dalmia BharatLtd are UltraTech Cem., Grasim Inds, Ambuja Cements, Shree Cement, J K Cements, ACC, The Ramco Cement, JSW Cement, Nuvoco Vistas, and India Cements.<BR><BR>Quality Snapshot: Excellent management risk is observed at UltraTech Cem. and Grasim Inds, while Average management risk is found at Ambuja Cements, Shree Cement, J K Cements, Dalmia BharatLtd, ACC, The Ramco Cement, Nuvoco Vistas, and India Cements. Good growth is seen at Grasim Inds and JSW Cement, whereas Average growth is present at UltraTech Cem., J K Cements, and the rest. Below Average growth is noted at Ambuja Cements, Shree Cement, Dalmia BharatLtd, ACC, The Ramco Cement, Nuvoco Vistas, and India Cements. Good capital structure is held by UltraTech Cem. and Dalmia BharatLtd, while Excellent capital structure is noted at Ambuja Cements and Shree Cement, and the rest have Below Average or Average capital structures.<BR><BR>Return Snapshot: Grasim Inds has the highest 1-year return at 19.69%, while Ambuja Cements has the lowest at -28.42%. Dalmia BharatLtd's 1-year return is -23.08%, which is better than Ambuja Cements but worse than Grasim Inds. Additionally, several peers, including Ambuja Cements, Shree Cement, J K Cements, ACC, The Ramco Cement, Nuvoco Vistas, and India Cements, have negative six-month returns.

View full answer

How big is Dalmia BharatLtd?

01-Sep-2026

As of 31st August, Dalmia Bharat Ltd has a market capitalization of 33,895.00 Cr, with recent net sales of 15,058.00 Cr and a net profit of 933.00 Cr.

As of 31st August, Dalmia Bharat Ltd has a market capitalization of 33,895.00 Cr, categorizing it as a Mid Cap company.<BR><BR>In the latest four quarters, Dalmia Bharat Ltd reported Net Sales of 15,058.00 Cr and a Net Profit of 933.00 Cr.<BR><BR>The latest annual period for the balance sheet is March 2026, with Shareholder's Funds amounting to 17,979.00 Cr and Total Assets of 33,259.00 Cr.

View full answer

Are Dalmia Bharat Ltd latest results good or bad?

25-Jul-2026

Dalmia Bharat Ltd's latest results are unfavorable, showing a 52.16% year-on-year decline in net profit to ₹188 crores, alongside contracting operating margins and rising debt levels, indicating significant profitability challenges.

Dalmia Bharat Ltd's latest results indicate a challenging quarter. The company reported a net profit of ₹188 crores for Q1 FY27, which represents a significant decline of 52.16% year-on-year and a staggering 51.42% drop sequentially from the previous quarter. While revenue grew modestly by 6.99% year-on-year to ₹3,890 crores, it contracted by 8.36% compared to the previous quarter, reflecting weak demand conditions in the cement sector.<BR><BR>The operating margin has also come under pressure, contracting to 20.69% from 24.28% in the same quarter last year, indicating deteriorating pricing power amid rising input costs. Additionally, the company's interest expenses surged by 36.11%, reflecting increased debt levels, which has raised concerns about financial sustainability.<BR><BR>Overall, the results highlight significant profitability challenges for Dalmia Bharat, with margin compression and rising leverage being critical issues. The combination of these factors suggests that the latest results are not favorable for the company.

View full answer

Should I buy, sell or hold Dalmia Bharat Ltd?

25-Jul-2026

When is the next results date for Dalmia Bharat Ltd?

17-Apr-2026

The next results date for Dalmia Bharat Ltd is April 28, 2026.

The next results date for Dalmia Bharat Ltd is scheduled for April 28, 2026.

View full answer

How has been the historical performance of Dalmia BharatLtd?

17-Oct-2025

Dalmia Bharat Ltd's historical performance shows fluctuating net sales and declining profits, with net sales at 13,980 Cr in Mar'25, down from 14,691 Cr in Mar'24. Despite growth in total assets and liabilities, profitability challenges are evident with a decrease in operating profit and net cash flow.

Answer:<BR>The historical performance of Dalmia Bharat Ltd shows a mixed trend in its financial metrics over the years.<BR><BR>Breakdown:<BR>Dalmia Bharat Ltd's net sales have fluctuated, reaching 13,980.00 Cr in Mar'25, down from 14,691.00 Cr in Mar'24, but up from 13,552.00 Cr in Mar'23. Total operating income followed a similar pattern, with a peak of 14,691.00 Cr in Mar'24 before declining to 13,980.00 Cr in Mar'25. The company's total expenditure (excluding depreciation) was 11,573.00 Cr in Mar'25, a decrease from 12,052.00 Cr in Mar'24. Operating profit (PBDIT) was 2,660.00 Cr in Mar'25, down from 2,954.00 Cr in Mar'24, while profit before tax decreased to 817.00 Cr in Mar'25 from 1,070.00 Cr in Mar'24. Profit after tax also saw a decline, reaching 699.00 Cr in Mar'25 compared to 854.00 Cr in Mar'24. The company's total assets increased to 30,171.00 Cr in Mar'25 from 27,712.00 Cr in Mar'24, and total liabilities rose to 30,171.00 Cr in Mar'25 from 27,712.00 Cr in Mar'24. Cash flow from operating activities was 2,117.00 Cr in Mar'25, down from 2,635.00 Cr in Mar'24, while net cash outflow was recorded at -192.00 Cr in Mar'25, contrasting with a positive inflow of 107.00 Cr in Mar'24. Overall, the financial performance of Dalmia Bharat Ltd reflects challenges in profitability amidst growth in total assets and liabilities.

View full answer

Is Dalmia BharatLtd technically bullish or bearish?

26-Sep-2025

As of September 25, 2025, Dalmia Bharat Ltd shows a mildly bullish trend overall, supported by bullish MACD and moving averages, despite mixed signals from KST and Dow Theory.

As of 25 September 2025, the technical trend for Dalmia Bharat Ltd has changed from bullish to mildly bullish. The weekly MACD remains bullish, while the monthly MACD is also bullish, indicating a positive momentum. The Bollinger Bands are mildly bullish on both weekly and monthly time frames, supporting the upward trend. However, the KST shows a mildly bearish stance on the weekly chart, which contrasts with its bullish monthly reading. The Dow Theory indicates a mildly bearish outlook on the weekly but is bullish on the monthly. The daily moving averages are mildly bullish, suggesting some short-term strength. Overall, the current technical stance is mildly bullish, driven primarily by the bullish MACD and moving averages, despite some mixed signals from KST and Dow Theory.

View full answer

Is Dalmia BharatLtd overvalued or undervalued?

05-Aug-2025

As of August 4, 2025, Dalmia Bharat Ltd is considered very expensive and overvalued with a PE Ratio of 45.21, an EV to EBITDA of 16.34, and a low ROE of 4.42%, despite outperforming the Sensex with a year-to-date return of 26.04%.

As of 4 August 2025, Dalmia Bharat Ltd has moved from an expensive to a very expensive valuation grade. The company is currently overvalued based on its financial metrics. Key ratios include a PE Ratio of 45.21, an EV to EBITDA of 16.34, and a Price to Book Value of 2.40, which indicate a high valuation relative to its earnings and book value.<BR><BR>In comparison to its peers, Dalmia Bharat's PE Ratio of 45.21 is lower than UltraTech Cement's 52.14 but higher than Grasim Industries' 47.6, while its EV to EBITDA is also higher than Grasim's 12.41. The company’s return on equity (ROE) stands at 4.42%, which is relatively low compared to the industry standards. Recent stock performance shows that Dalmia Bharat has outperformed the Sensex, with a year-to-date return of 26.04% compared to the Sensex's 3.69%, further reinforcing its current overvaluation status.

View full answer

Who are the top shareholders of the Dalmia BharatLtd?

17-Jul-2025

The top shareholders of Dalmia Bharat Ltd include Mayuka Investment Limited with 20.76%, mutual funds at 10.04%, foreign institutional investors at 8.28%, and the Life Insurance Corporation of India - P & Gs Fund at 5.09%, with individual investors holding 9.78%. Promoters are the majority shareholders.

The top shareholders of Dalmia Bharat Ltd include a mix of promoters and institutional investors. The majority shareholders are the promoters, with Mayuka Investment Limited holding the highest stake at 20.76%. Additionally, mutual funds collectively hold 10.04% of the shares, while foreign institutional investors (FIIs) own 8.28%. The highest public shareholder is the Life Insurance Corporation of India - P & Gs Fund, which holds 5.09%. Individual investors account for 9.78% of the holdings.

View full answer

Has Dalmia BharatLtd declared dividend?

06-Jun-2025

Yes, Dalmia Bharat Ltd has declared a dividend of 250%, amounting to ₹4 per share, with an ex-date of June 23, 2025. The company has shown strong total returns over various periods, particularly a 272.51% total return over the past 5 years.

Dalmia Bharat Ltd has declared a dividend.<BR><BR>Dividend Details:<BR>- Percentage announced: 250%<BR>- Amount per share: 4<BR>- Ex-date: 23 Jun 25<BR><BR>Dividend Yield: 0.43%.<BR><BR>Total Returns by Period:<BR>In the last 6 months, the price return was 8.42%, the dividend return was 0.26%, resulting in a total return of 8.68%.<BR><BR>Over the past year, the price return was 17.89%, the dividend return was 0.74%, leading to a total return of 18.63%.<BR><BR>In the last 2 years, the price return was -3.37%, with a dividend return of 1.03%, resulting in a total return of -2.34%.<BR><BR>For the 3-year period, the price return was 62.93%, the dividend return was 2.25%, culminating in a total return of 65.18%.<BR><BR>In the last 4 years, the price return was 16.5%, the dividend return was 1.78%, yielding a total return of 18.28%.<BR><BR>Over the past 5 years, the price return was 267.79%, with a dividend return of 4.72%, resulting in a total return of 272.51%.<BR><BR>Overall, Dalmia Bharat Ltd has declared a significant dividend, and the total returns over various periods indicate a strong performance, particularly over the longer term, with substantial price appreciation and consistent dividend contributions.

View full answer
iScoreScore
Click here to find our call on this stock
Strong Sell
Sell
Hold
Buy
Strong Buy

Dashboard

1

Poor long term growth as Net Sales has grown by an annual rate of 6.64% and Operating profit at 0.04% over the last 5 years

 
2

Flat results in Jun 26

3

Underperformed the market in the last 1 year

stock-summaryMojo Parameters

Mojo Parameters

Loading Valuation Snapshot...

Stock DNA

stock-summary
Industry

Cement & Cement Products

stock-summary
Market cap

INR 33,334 Cr (Mid Cap)

stock-summary
P/E

30.00

stock-summary
Industry P/E

32

stock-summary
Dividend Yield

0.50%

stock-summary
Debt Equity

0.12

stock-summary
Return on Equity

6.45%

stock-summary
Price to Book

1.88

Revenue and Profits:
Net Sales:
3,890 Cr
(Quarterly Results - Jun 2026)
Net Profit:
188 Cr
stock-summaryTotal Returns
Total Returns (Price + Dividend) stock-summary
Dividend Yield (0.5%)
TimePeriod
Price Return
Dividend Return
Total Return
3 Months
2.53%
0%
2.53%
6 Months
-4.14%
0.27%
-3.87%
1 Year
-26.85%
0.41%
-26.44%
2 Years
-3.92%
0.92%
-3.0%
3 Years
-22.16%
1.22%
-20.94%
4 Years
5.0%
2.10%
7.1%
5 Years
-18.2%
1.97%
-16.23%

Latest dividend: 5 per share ex-dividend date: Jun-23-2026

Risk Adjusted Returns v/s stock-summary
Returns Beta
Icon
Beta has not been calculated since enough price history is not available
stock-summaryNews & Corporate Actions

News

Dalmia Bharat Ltd Gains 0.94%: 2 Key Factors Driving the Week’s Momentum

Announcements stock-summary

Shareholder Meeting / Postal Ballot-Notice of Postal Ballot

18-Sep-2026 | Source : BSE

Intimation of Postal Ballot Notice and remote e-voting period.

Announcement under Regulation 30 (LODR)-Acquisition

17-Sep-2026 | Source : BSE

Acquisition (AMPL Green City Solutions Pvt Ltd)

Regulation 30 Of SEBI (Listing Obligations And Disclosure Requirements) Regulations 2015 (Listing Regulations)

24-Aug-2026 | Source : BSE

Amendment to the MMDR Act 1957

Corporate Actions stock-summary

stock-summary
BOARD MEETING

No Upcoming Board Meetings

stock-summary
DIVIDEND

Dalmia Bharat Ltd has declared 250% dividend, ex-date: 23 Jun 26

stock-summary
SPLITS

No Splits history available

stock-summary
BONUS

No Bonus history available

stock-summary
RIGHTS

No Rights history available

stock-summaryKey Factors

Quality key factors stock-summary

Factor
Value
Sales Growth (5y)
6.64%
EBIT Growth (5y)
0.04%
EBIT to Interest (avg)
3.71
Debt to EBITDA (avg)
1.88
Net Debt to Equity (avg)
0.12
Sales to Capital Employed (avg)
0.64
Tax Ratio
19.56%
Dividend Payout Ratio
15.01%
Pledged Shares
0
Institutional Holding
26.88%
ROCE (avg)
7.31%
ROE (avg)
6.04%

Valuation key factors

Factor
Value
P/E Ratio
30
Industry P/E
32
Price to Book Value
1.84
EV to EBIT
21.78
EV to EBITDA
11.72
EV to Capital Employed
1.76
EV to Sales
2.34
PEG Ratio
1.53
Dividend Yield
0.51%
ROCE (Latest)
8.65%
ROE (Latest)
6.45%

Technicals key factors

Indicator
Weekly
Monthly
MACD
Mildly Bullish
Bearish
RSI
No Signal
No Signal
Bollinger Bands
Sideways
Bearish
Moving Averages
Bearish (Daily)
KST
Mildly Bullish
Bearish
Dow Theory
Mildly Bullish
Mildly Bullish
OBV
No Trend
No Trend
stock-summary Technical Indicator Scale: Bearish, Mildly Bearish, Sideways, Mildly Bullish, Bullish  Turned 
stock-summaryShareholding
Shareholding Snapshot : Jun 2026stock-summary
Shareholding Compare (%holding) stock-summary
Majority shareholders

Promoters

Pledged Promoter Holdings

None

Mutual Funds

Held by 29 Schemes (16.62%)

FIIs

Held by 139 FIIs (6.81%)

Promoter with highest holding

Keshav Power Limited (36.04%)

Highest Public shareholder

Kotak Midcap Fund (6.69%)

Individual Investors Holdings

8.52%

stock-summaryFinancial
[
  {
    "link": "quarterly",
    "btn_text": "All Quarterly Results",
    "header": "Quarterly Results Snapshot (Consolidated) - Jun'26 - QoQ",
    "rhs": [
      {
        "prefix": "Net Sales ",
        "suffix": "QoQ Growth in quarter ended Jun 2026 is -8.36% vs 21.08% in Mar 2026",
        "dir": -1
      },
      {
        "prefix": "Consolidated Net Profit ",
        "suffix": "QoQ Growth in quarter ended Jun 2026 is -51.42% vs 217.21% in Mar 2026",
        "dir": -1
      }
    ],
    "table": {
      "header": [
        "Jun'26",
        "Mar'26",
        "Change(%)"
      ],
      "body": [
        {
          "field": "Net Sales",
          "val1": "3,890.00",
          "val2": "4,245.00",
          "chgp": "-8.36%",
          "chgp_class": "negative"
        },
        {
          "field": "Operating Profit (PBDIT) excl Other Income",
          "val1": "805.00",
          "val2": "902.00",
          "chgp": "-10.75%",
          "chgp_class": "negative"
        },
        {
          "field": "Interest",
          "val1": "147.00",
          "val2": "132.00",
          "chgp": "11.36%",
          "chgp_class": "negative"
        },
        {
          "field": "Exceptional Items",
          "val1": "-182.00",
          "val2": "-11.00",
          "chgp": "-1,554.55%",
          "chgp_class": "negative"
        },
        {
          "field": "Consolidate Net Profit",
          "val1": "188.00",
          "val2": "387.00",
          "chgp": "-51.42%",
          "chgp_class": "negative"
        },
        {
          "field": "Operating Profit Margin (Excl OI)",
          "val1": "20.69%",
          "val2": "21.25%",
          "chgp": "-0.56%",
          "chgp_class": "negative"
        }
      ]
    }
  },
  {
    "link": "half-yearly",
    "btn_text": "All Half Yearly Results",
    "header": "Half Yearly Results Snapshot (Consolidated) - Sep'25",
    "rhs": [
      {
        "prefix": "Net Sales ",
        "suffix": " Growth in half year ended Sep 2025 is 5.14% vs -1.06% in Sep 2024",
        "dir": 1
      },
      {
        "prefix": "Consolidated Net Profit ",
        "suffix": " Growth in half year ended Sep 2025 is 236.36% vs -24.60% in Sep 2024",
        "dir": 1
      }
    ],
    "table": {
      "header": [
        "Sep'25",
        "Sep'24",
        "Change(%)"
      ],
      "body": [
        {
          "field": "Net Sales",
          "val1": "7,053.00",
          "val2": "6,708.00",
          "chgp": "5.14%",
          "chgp_class": "positive"
        },
        {
          "field": "Operating Profit (PBDIT) excl Other Income",
          "val1": "1,579.00",
          "val2": "1,103.00",
          "chgp": "43.16%",
          "chgp_class": "positive"
        },
        {
          "field": "Interest",
          "val1": "230.00",
          "val2": "193.00",
          "chgp": "19.17%",
          "chgp_class": "negative"
        },
        {
          "field": "Exceptional Items",
          "val1": "16.00",
          "val2": "-113.00",
          "chgp": "114.16%",
          "chgp_class": "positive"
        },
        {
          "field": "Consolidate Net Profit",
          "val1": "629.00",
          "val2": "187.00",
          "chgp": "236.36%",
          "chgp_class": "positive"
        },
        {
          "field": "Operating Profit Margin (Excl OI)",
          "val1": "22.39%",
          "val2": "16.44%",
          "chgp": "5.95%",
          "chgp_class": "positive"
        }
      ]
    }
  },
  {
    "link": "nine-monthly",
    "btn_text": "All Nine Monthly Results",
    "header": "Nine Monthly Results Snapshot (Consolidated) - Dec'25",
    "rhs": [
      {
        "prefix": "Net Sales ",
        "suffix": "YoY Growth in nine months ended Dec 2025 is 6.78% vs -4.77% in Dec 2024",
        "dir": 1
      },
      {
        "prefix": "Consolidated Net Profit ",
        "suffix": "YoY Growth in nine months ended Dec 2025 is 202.82% vs -51.47% in Dec 2024",
        "dir": 1
      }
    ],
    "table": {
      "header": [
        "Dec'25",
        "Dec'24",
        "Change(%)"
      ],
      "body": [
        {
          "field": "Net Sales",
          "val1": "10,559.00",
          "val2": "9,889.00",
          "chgp": "6.78%",
          "chgp_class": "positive"
        },
        {
          "field": "Operating Profit (PBDIT) excl Other Income",
          "val1": "2,181.00",
          "val2": "1,614.00",
          "chgp": "35.13%",
          "chgp_class": "positive"
        },
        {
          "field": "Interest",
          "val1": "348.00",
          "val2": "294.00",
          "chgp": "18.37%",
          "chgp_class": "negative"
        },
        {
          "field": "Exceptional Items",
          "val1": "-16.00",
          "val2": "-113.00",
          "chgp": "85.84%",
          "chgp_class": "positive"
        },
        {
          "field": "Consolidate Net Profit",
          "val1": "751.00",
          "val2": "248.00",
          "chgp": "202.82%",
          "chgp_class": "positive"
        },
        {
          "field": "Operating Profit Margin (Excl OI)",
          "val1": "20.66%",
          "val2": "16.32%",
          "chgp": "4.34%",
          "chgp_class": "positive"
        }
      ]
    }
  },
  {
    "link": "annual",
    "btn_text": "All Annual Results",
    "header": "Annual Results Snapshot (Consolidated) - Mar'26",
    "rhs": [
      {
        "prefix": "Net Sales ",
        "suffix": "YoY Growth in year ended Mar 2026 is 5.89% vs -4.84% in Mar 2025",
        "dir": 1
      },
      {
        "prefix": "Consolidated Net Profit ",
        "suffix": "YoY Growth in year ended Mar 2026 is 66.76% vs -17.31% in Mar 2025",
        "dir": 1
      }
    ],
    "table": {
      "header": [
        "Mar'26",
        "Mar'25",
        "Change(%)"
      ],
      "body": [
        {
          "field": "Net Sales",
          "val1": "14,804.00",
          "val2": "13,980.00",
          "chgp": "5.89%",
          "chgp_class": "positive"
        },
        {
          "field": "Operating Profit (PBDIT) excl Other Income",
          "val1": "3,083.00",
          "val2": "2,407.00",
          "chgp": "28.08%",
          "chgp_class": "positive"
        },
        {
          "field": "Interest",
          "val1": "480.00",
          "val2": "399.00",
          "chgp": "20.30%",
          "chgp_class": "negative"
        },
        {
          "field": "Exceptional Items",
          "val1": "-27.00",
          "val2": "-113.00",
          "chgp": "76.11%",
          "chgp_class": "positive"
        },
        {
          "field": "Consolidate Net Profit",
          "val1": "1,139.00",
          "val2": "683.00",
          "chgp": "66.76%",
          "chgp_class": "positive"
        },
        {
          "field": "Operating Profit Margin (Excl OI)",
          "val1": "20.83%",
          "val2": "17.22%",
          "chgp": "3.61%",
          "chgp_class": "positive"
        }
      ]
    }
  }
]

Quarterly Results Snapshot (Consolidated) - Jun'26 - QoQstock-summary

Jun'26
Mar'26
Change(%)
Net Sales
3,890.00
4,245.00
-8.36%
Operating Profit (PBDIT) excl Other Income
805.00
902.00
-10.75%
Interest
147.00
132.00
11.36%
Exceptional Items
-182.00
-11.00
-1,554.55%
Consolidate Net Profit
188.00
387.00
-51.42%
Operating Profit Margin (Excl OI)
20.69%
21.25%
-0.56%
Values in Rs Cr.
Direction Arrows
Net Sales

QoQ Growth in quarter ended Jun 2026 is -8.36% vs 21.08% in Mar 2026

Direction Arrows
Consolidated Net Profit

QoQ Growth in quarter ended Jun 2026 is -51.42% vs 217.21% in Mar 2026

Half Yearly Results Snapshot (Consolidated) - Sep'25stock-summary

Sep'25
Sep'24
Change(%)
Net Sales
7,053.00
6,708.00
5.14%
Operating Profit (PBDIT) excl Other Income
1,579.00
1,103.00
43.16%
Interest
230.00
193.00
19.17%
Exceptional Items
16.00
-113.00
114.16%
Consolidate Net Profit
629.00
187.00
236.36%
Operating Profit Margin (Excl OI)
22.39%
16.44%
5.95%
Values in Rs Cr.
Direction Arrows
Net Sales

Growth in half year ended Sep 2025 is 5.14% vs -1.06% in Sep 2024

Direction Arrows
Consolidated Net Profit

Growth in half year ended Sep 2025 is 236.36% vs -24.60% in Sep 2024

Nine Monthly Results Snapshot (Consolidated) - Dec'25stock-summary

Dec'25
Dec'24
Change(%)
Net Sales
10,559.00
9,889.00
6.78%
Operating Profit (PBDIT) excl Other Income
2,181.00
1,614.00
35.13%
Interest
348.00
294.00
18.37%
Exceptional Items
-16.00
-113.00
85.84%
Consolidate Net Profit
751.00
248.00
202.82%
Operating Profit Margin (Excl OI)
20.66%
16.32%
4.34%
Values in Rs Cr.
Direction Arrows
Net Sales

YoY Growth in nine months ended Dec 2025 is 6.78% vs -4.77% in Dec 2024

Direction Arrows
Consolidated Net Profit

YoY Growth in nine months ended Dec 2025 is 202.82% vs -51.47% in Dec 2024

Annual Results Snapshot (Consolidated) - Mar'26stock-summary

Mar'26
Mar'25
Change(%)
Net Sales
14,804.00
13,980.00
5.89%
Operating Profit (PBDIT) excl Other Income
3,083.00
2,407.00
28.08%
Interest
480.00
399.00
20.30%
Exceptional Items
-27.00
-113.00
76.11%
Consolidate Net Profit
1,139.00
683.00
66.76%
Operating Profit Margin (Excl OI)
20.83%
17.22%
3.61%
Values in Rs Cr.
Direction Arrows
Net Sales

YoY Growth in year ended Mar 2026 is 5.89% vs -4.84% in Mar 2025

Direction Arrows
Consolidated Net Profit

YoY Growth in year ended Mar 2026 is 66.76% vs -17.31% in Mar 2025

stock-summaryCompany CV
About Dalmia Bharat Ltd stock-summary
stock-summary
Dalmia Bharat Ltd
Mid Cap
Cement & Cement Products
Dalmia Bharat Limited (DBL), a leading cement major producers, was established in 1939 by Shri Jaidayal Dalmia with a cumulative installed capacity of 44.6 MTPA. The Company presently has 15 manufacturing plants, serving customers across 23 states with a network of 41,000+ dealers and sub dealers. It has a significant market presence in each of its three businesses - Cement, Sugar and Refractories.
Company Coordinates stock-summary
Company Details
Dalmiapuram Lalgudi , Tiruchirapalli Tamil Nadu : 621651
stock-summary
Tel: 91-4329-235132
stock-summary
corp.sec@dalmiabharat.com
Registrar Details
Karvy Computershare Pvt Ltd., Karvy Selenium, Tower-B Plot No 31 & 32, Survey No 116/22, 115/24, 115/25, Financial District, Nanakramguda, Serilingampally, Mandal Ranga Reddy Dist, Hyderabad