
Compare Data Pattern with Similar Stocks
Dashboard
The company is Net-Debt Free
Healthy long term growth as Net Sales has grown by an annual rate of 31.33%
The company has declared Positive results for the last 3 consecutive quarters
With ROE of 15.8, it has a Very Expensive valuation with a 13.7 Price to Book Value
High Institutional Holdings at 24.48%
Market Beating performance in long term as well as near term
Stock DNA
Aerospace & Defense
INR 26,665 Cr (Small Cap)
87.00
44
0.19%
-0.24
15.77%
13.68
Total Returns (Price + Dividend) 
Latest dividend: 7.9 per share ex-dividend date: Aug-01-2025
Risk Adjusted Returns v/s
Returns Beta

News
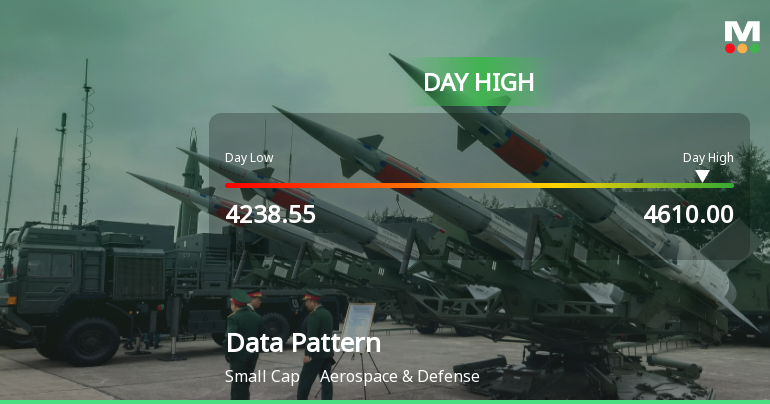
Data Patterns (India) Ltd Surges 8.3% to Day's High of Rs 4544 — Outperforms Sector by 7.43 Percentage Points
While the Sensex declined by 0.83% on 22 Jul 2026, Data Patterns (India) Ltd surged 8.3%, reaching an intraday high of Rs 4544. This 7.43 percentage-point outperformance over its Aerospace & Defense sector peers highlights a distinctly stock-specific rally amid a broadly weak market environment.
Read full news article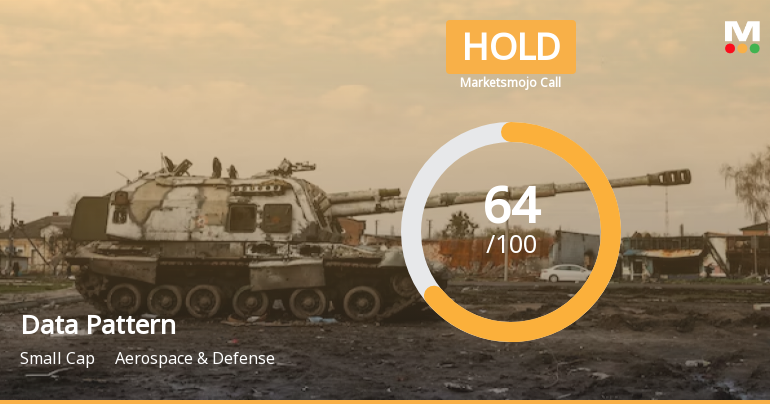
Data Patterns (India) Ltd is Rated Hold
Data Patterns (India) Ltd is rated 'Hold' by MarketsMOJO, with this rating last updated on 13 July 2026. However, the analysis and financial metrics discussed here reflect the stock's current position as of 22 July 2026, providing investors with the most up-to-date view of the company’s fundamentals and market performance.
Read full news article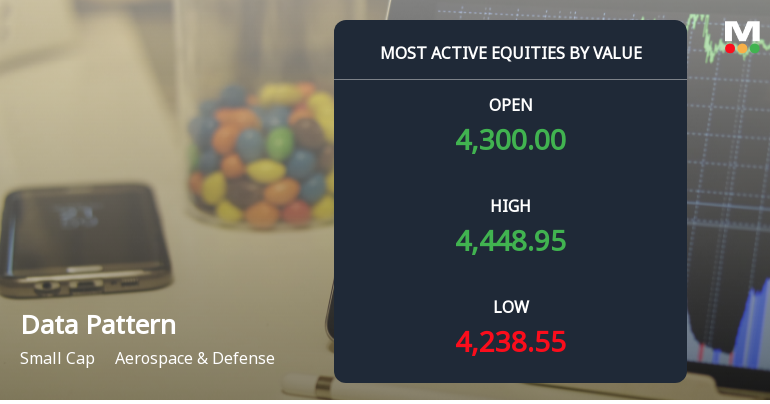
Data Patterns (India) Ltd Sees Robust Trading Activity Amid Sector Outperformance
Data Patterns (India) Ltd, a small-cap player in the Aerospace & Defense sector, has witnessed significant trading momentum with a 3.39% gain on 22 Jul 2026, driven by strong institutional interest and high value turnover. The stock outperformed its sector and the broader Sensex, reflecting growing investor confidence despite a recent downgrade in its Mojo Grade.
Read full news article Announcements
Compliances-Certificate under Reg. 74 (5) of SEBI (DP) Regulations 2018
15-Jul-2026 | Source : BSEPlease find enclosed herewith the Certificate received from M/s. MUFG Intime India Private Limited Registrar and Transfer Agent of the Company for the quarter ended June 30 2026 stating that there was no request received for dematerialization of securities and the securities of the Company are fully in demat form.
Revised Notice Of 28Th Annual General Meeting (AGM) And E-Voting Details.
09-Jul-2026 | Source : BSEPlease find attached revised Notice of 28th Annual General Meeting of the Company dated June 25 2026 for the meeting scheduled to be held on Friday July 31 2026 at 11.00 am IST through VC/OAVM. Please note that AGM Notice is being filed separately from the Annual Report which was submitted together in the previous filings. We would like to reiterate there is no change in the Notice of AGM.
Reg. 34 (1) Annual Report.
09-Jul-2026 | Source : BSEPlease find enclosed herewith the Revised Annual Report (including the Business Responsibility and Sustainability Report) for the Financial Year 2025-26. Please note that the revision in the Annual Report is pertaining to removal of certain client related data on the cover page based on their request. We would like to reiterate that aforementioned changes are carried out in the non-statutory part of the Annual Report there is no change in the statutory contents of the Annual Report.
Corporate Actions

No Upcoming Board Meetings

Data Patterns (India) Ltd has declared 500% dividend, ex-date: 24 Jul 26

No Splits history available

No Bonus history available

No Rights history available
Quality key factors
Valuation key factors
Technicals key factors
 Technical Indicator Scale: Bearish, Mildly Bearish, Sideways, Mildly Bullish, Bullish Turned
 Shareholding Snapshot : Jun 2026
Shareholding Compare (%holding)
Promoters
None
Held by 29 Schemes (9.85%)
Held by 162 FIIs (12.5%)
Rangarajan S (22.8%)
Desingu Rajan P (2.58%)
26.5%
Quarterly Results Snapshot (Standalone) - Mar'26 - QoQ

QoQ Growth in quarter ended Mar 2026 is 99.19% vs -43.69% in Dec 2025
QoQ Growth in quarter ended Mar 2026 is 137.36% vs 18.52% in Dec 2025
Half Yearly Results Snapshot (Standalone) - Sep'25
Growth in half year ended Sep 2025 is 108.50% vs -1.46% in Sep 2024
Growth in half year ended Sep 2025 is 18.42% vs 5.79% in Sep 2024
Nine Monthly Results Snapshot (Standalone) - Dec'25
YoY Growth in nine months ended Dec 2025 is 85.79% vs -7.52% in Dec 2024
YoY Growth in nine months ended Dec 2025 is 23.45% vs -2.59% in Dec 2024
Annual Results Snapshot (Standalone) - Mar'26

YoY Growth in year ended Mar 2026 is 30.55% vs 36.27% in Mar 2025
YoY Growth in year ended Mar 2026 is 22.34% vs 22.08% in Mar 2025
About Data Patterns (India) Ltd

Company Coordinates


