
Compare Davangere Sugar with Similar Stocks
Dashboard
Weak Long Term Fundamental Strength with an average Return on Capital Employed (ROCE) of 5.96%
- Poor long term growth as Net Sales has grown by an annual rate of 10.56% and Operating profit at 16.91% over the last 5 years
- Low ability to service debt as the company has a high Debt to EBITDA ratio of 5.14 times
Flat results in Mar 26
Despite the size of the company, domestic mutual funds hold only 0% of the company
Total Returns (Price + Dividend) 
Davangere Sugar for the last several years.
Risk Adjusted Returns v/s
Returns Beta

News
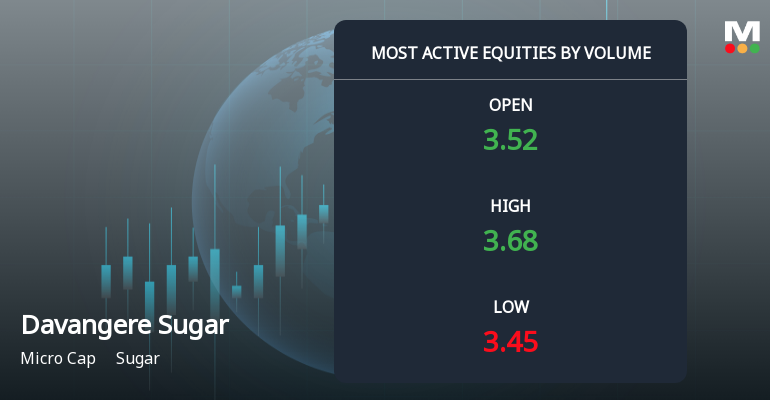
Davangere Sugar Company Ltd Sees Exceptional Volume Amidst Bearish Momentum
Davangere Sugar Company Ltd (DAVANGERE) emerged as one of the most actively traded stocks by volume on 14 Jul 2026, registering a total traded volume of 94.44 lakh shares and a traded value of ₹3.36 crores. Despite this surge in activity, the stock remains under pressure, reflecting a complex interplay of market sentiment and sectoral challenges.
Read full news article
Davangere Sugar Company Ltd is Rated Strong Sell
Davangere Sugar Company Ltd is rated Strong Sell by MarketsMOJO, with this rating last updated on 02 March 2026. However, the analysis and financial metrics presented here reflect the stock’s current position as of 13 July 2026, providing investors with an up-to-date perspective on the company’s fundamentals, valuation, financial trends, and technical outlook.
Read full news article
Davangere Sugar Company Ltd is Rated Strong Sell
Davangere Sugar Company Ltd is rated Strong Sell by MarketsMOJO, with this rating last updated on 02 March 2026. However, the analysis and financial metrics discussed here reflect the stock’s current position as of 02 July 2026, providing investors with an up-to-date view of the company’s fundamentals, valuation, financial trend, and technical outlook.
Read full news article Announcements
Announcement under Regulation 30 (LODR)-Allotment
09-Jul-2026 | Source : BSEOutcome of Board Meeting- Allotment of Unsecured Foreign Currency Convertible Bonds.
Listing Of Foreign Currency Convertible Bonds (Fccbs) On The Afrinex Stock Exchange Mauritius
09-Jul-2026 | Source : BSEAttached the letter informing that the company has listed its FCCB on the Afrinex Stock Exchange Mauritius.
FCCB Offering Was Fully Subscribed In Terms Of The Offering Circular
08-Jul-2026 | Source : BSEFCCB offering was fully subscribed in terms of offering circular
Corporate Actions

No Upcoming Board Meetings

No Dividend history available

Davangere Sugar Company Ltd has announced 1:10 stock split, ex-date: 31 May 24

No Bonus history available

Davangere Sugar Company Ltd has announced 13:25 rights issue, ex-date: 06 Aug 25
Quality key factors
Valuation key factors
Technicals key factors
 Technical Indicator Scale: Bearish, Mildly Bearish, Sideways, Mildly Bullish, Bullish Turned
 Shareholding Snapshot : Mar 2026
Shareholding Compare (%holding)
Non Institution
None
Held by 0 Schemes
Held by 7 FIIs (6.99%)
Ganesh S S (24.99%)
Davangere Sugar Company Limited (6.17%)
28.82%
Quarterly Results Snapshot (Standalone) - Mar'26 - QoQ

QoQ Growth in quarter ended Mar 2026 is 1.37% vs 71.59% in Dec 2025
QoQ Growth in quarter ended Mar 2026 is -25.57% vs -0.38% in Dec 2025
Half Yearly Results Snapshot (Standalone) - Sep'25
Growth in half year ended Sep 2025 is -14.89% vs 13.73% in Sep 2024

Growth in half year ended Sep 2025 is 76.23% vs 7.73% in Sep 2024
Nine Monthly Results Snapshot (Standalone) - Dec'25
YoY Growth in nine months ended Dec 2025 is -1.98% vs 3.35% in Dec 2024
YoY Growth in nine months ended Dec 2025 is -27.22% vs 17.19% in Dec 2024
Annual Results Snapshot (Standalone) - Mar'26
YoY Growth in year ended Mar 2026 is 11.06% vs -0.71% in Mar 2025
YoY Growth in year ended Mar 2026 is -22.21% vs -10.62% in Mar 2025
About Davangere Sugar Company Ltd

Company Coordinates


