
Compare DCM Shriram Inds with Similar Stocks
Dashboard
Poor long term growth as Net Sales has grown by an annual rate of -6.81% and Operating profit at -5.66% over the last 5 years
Flat results in Mar 26
With ROCE of 9.4, it has a Very Attractive valuation with a 0.6 Enterprise value to Capital Employed
Majority shareholders : Promoters
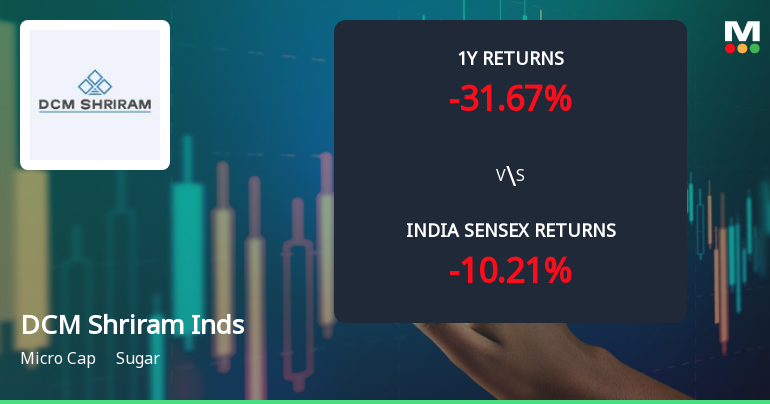
Underperformed the market in the last 1 year
Total Returns (Price + Dividend) 
Latest dividend: 2 per share ex-dividend date: Apr-04-2025
Risk Adjusted Returns v/s
Returns Beta

News
DCM Shriram Industries Ltd Technical Momentum Shifts Amid Mixed Market Signals
DCM Shriram Industries Ltd, a micro-cap player in the sugar sector, has experienced a notable shift in its technical momentum, moving from a sideways trend to a mildly bearish stance. Despite some bullish signals on longer-term indicators, the stock’s recent price action and technical parameters suggest caution for investors navigating this volatile phase.
Read full news article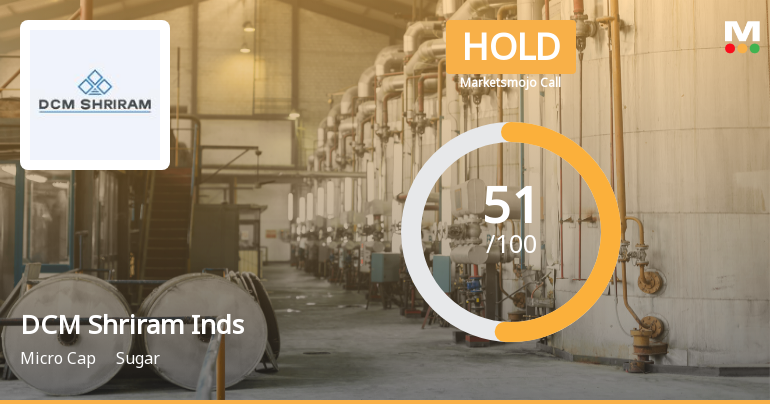
DCM Shriram Industries Upgraded to Hold as Financial and Technical Trends Stabilise
DCM Shriram Industries Ltd, a micro-cap player in the sugar sector, has seen its investment rating upgraded from Sell to Hold as of 9 June 2026. This change reflects a notable improvement across key parameters including financial performance, valuation, technical indicators, and overall quality metrics. Despite recent challenges, the company’s stabilising financial trend and evolving technical outlook have prompted a reassessment of its market stance.
Read full news article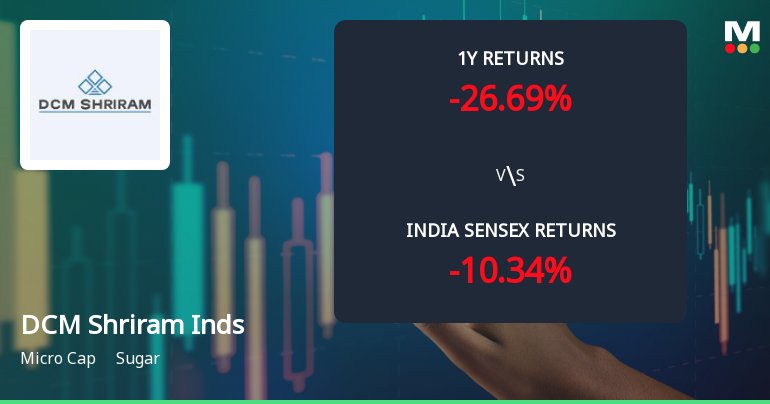
DCM Shriram Industries Ltd Technical Momentum Shifts Amid Mixed Indicators
DCM Shriram Industries Ltd has experienced a notable shift in its technical momentum, moving from a mildly bearish stance to a sideways trend as of early June 2026. This transition is underscored by a complex interplay of technical indicators, including MACD, RSI, Bollinger Bands, and moving averages, reflecting a nuanced market sentiment for the sugar sector micro-cap stock.
Read full news article Announcements
Newspaper Publication - Pre-Intimation Regarding 35Th AGM
29-May-2026 | Source : BSENewspaper Publication - Pre-intimation regarding 35th Annual General Meeting
Compliances-Reg.24(A)-Annual Secretarial Compliance
22-May-2026 | Source : BSEAnnual Secretarial Compliance Report for the year ended 31st March 2026.
Announcement under Regulation 30 (LODR)-Newspaper Publication
21-May-2026 | Source : BSENewspaper Publication - Audited Financial Results for the Quarter and Financial Year ended 31st March 2026.
Corporate Actions

No Upcoming Board Meetings

DCM Shriram Industries Ltd has declared 100% dividend, ex-date: 04 Apr 25

DCM Shriram Industries Ltd has announced 2:10 stock split, ex-date: 08 Oct 21

No Bonus history available

No Rights history available
Quality key factors
Valuation key factors
Technicals key factors
 Technical Indicator Scale: Bearish, Mildly Bearish, Sideways, Mildly Bullish, Bullish Turned
 Shareholding Snapshot : Mar 2026
Shareholding Compare (%holding)
Promoters
None
Held by 3 Schemes (0.0%)
Held by 15 FIIs (1.17%)
Lala Bansi Dhar & Sons (13.83%)
Life Insurance Corporation Of India (4.64%)
26.75%
Quarterly Results Snapshot (Standalone) - Mar'26 - QoQ

QoQ Growth in quarter ended Mar 2026 is 6.87% vs -23.82% in Dec 2025

QoQ Growth in quarter ended Mar 2026 is 37.87% vs 232.56% in Dec 2025
Half Yearly Results Snapshot (Consolidated) - Sep'25
Growth in half year ended Sep 2025 is -5.66% vs -1.44% in Sep 2024
Growth in half year ended Sep 2025 is -74.66% vs 13.80% in Sep 2024
Nine Monthly Results Snapshot (Standalone) - Dec'25
YoY Growth in nine months ended Dec 2025 is -4.72% vs -14.19% in Dec 2024
YoY Growth in nine months ended Dec 2025 is -46.95% vs -20.27% in Dec 2024
Annual Results Snapshot (Standalone) - Mar'26
YoY Growth in year ended Mar 2026 is 7.77% vs -47.97% in Mar 2025
YoY Growth in year ended Mar 2026 is 37.87% vs -73.74% in Mar 2025
About DCM Shriram Industries Ltd

Company Coordinates


