
Compare Dec.Gold Mines with Similar Stocks
Dashboard
With a Operating Losses, the company has a Weak Long Term Fundamental Strength
- Poor long term growth as Operating profit has grown by an annual rate -276.43% of over the last 5 years
- Low ability to service debt as the company has a high Debt to EBITDA ratio of -1.14 times
Flat results in Mar 26
Risky - Negative EBITDA
Despite the size of the company, domestic mutual funds hold only 0% of the company
Stock DNA
Non - Ferrous Metals
INR 3,181 Cr (Small Cap)
NA (Loss Making)
11
0.00%
0.08
-10.61%
6.11
Total Returns (Price + Dividend) 
Dec.Gold Mines for the last several years.
Risk Adjusted Returns v/s
Returns Beta

News
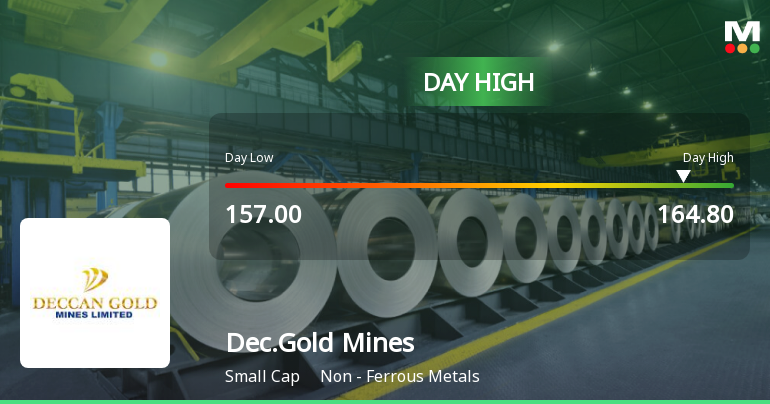
Deccan Gold Mines Ltd Surges 7.12% to Day's High of Rs 163.05 — Outperforms Sector by 5.97 Percentage Points
The Sensex slipped 0.91% on 12 Jun 2026, while Deccan Gold Mines Ltd surged 7.12%, outperforming its Non - Ferrous Metals sector by nearly 6 percentage points. This sharp single-session gain stands out as a stock-specific event amid a broadly weak market backdrop.
Read full news article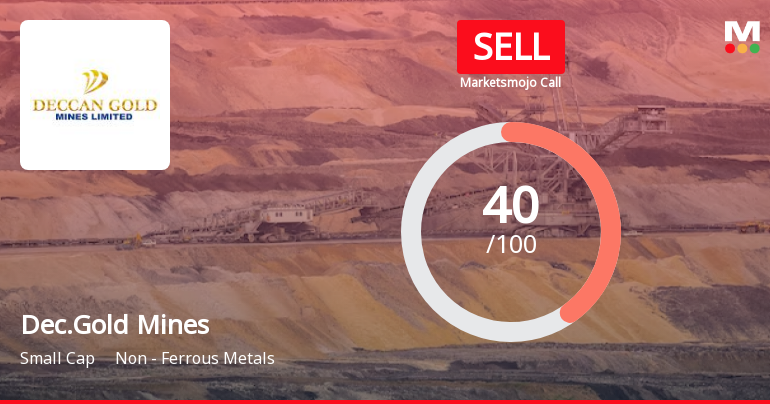
Deccan Gold Mines Ltd is Rated Sell
Deccan Gold Mines Ltd is rated 'Sell' by MarketsMOJO, with this rating last updated on 19 May 2026. However, the analysis and financial metrics discussed here reflect the stock's current position as of 11 June 2026, providing investors with the latest insights into the company’s performance and outlook.
Read full news article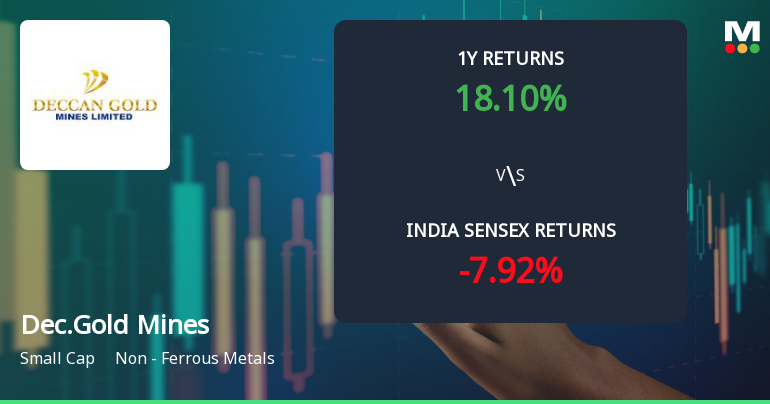
Deccan Gold Mines Ltd Sees Bullish Momentum Amid Technical Upgrades
Deccan Gold Mines Ltd has demonstrated a significant shift in price momentum, moving from a mildly bullish to a bullish technical trend, supported by strong signals from key indicators such as MACD, Bollinger Bands, and moving averages. This technical upgrade comes alongside a notable 5.27% gain in the stock price on 4 June 2026, reflecting renewed investor confidence in the non-ferrous metals sector.
Read full news article Announcements
Availing Loan Of Rs. 2 Crore From Modali Consultants LLP
10-Jun-2026 | Source : BSEPlease refer the attached letter.
Announcement under Regulation 30 (LODR)-Press Release / Media Release
10-Jun-2026 | Source : BSEPress Release on Deccan Gold Signs Definitive Earn-In Agreement for Strategic Spanish Tungsten Project Amid Global Critical Minerals Race.
Announcement under Regulation 30 (LODR)-Acquisition
09-Jun-2026 | Source : BSEAcquisition of 51 % Stake in Logrosan Minera S.L Spain.
Corporate Actions

No Upcoming Board Meetings

No Dividend history available

No Splits history available

No Bonus history available

Deccan Gold Mines Ltd has announced 150:601 rights issue, ex-date: 09 Dec 25
Quality key factors
Valuation key factors
Technicals key factors
 Technical Indicator Scale: Bearish, Mildly Bearish, Sideways, Mildly Bullish, Bullish Turned
 Shareholding Snapshot : Mar 2026
Shareholding Compare (%holding)
Non Institution
None
Held by 0 Schemes
Held by 4 FIIs (1.84%)
Rama Mines (mauritius ) Limited (12.67%)
Hira Infra Tek Limited (9.65%)
51.68%
Quarterly Results Snapshot (Consolidated) - Mar'26 - YoY

YoY Growth in quarter ended Mar 2026 is 1,885.11% vs -85.45% in Mar 2025

YoY Growth in quarter ended Mar 2026 is -47.27% vs 121.44% in Mar 2025
Half Yearly Results Snapshot (Consolidated) - Sep'25
Growth in half year ended Sep 2025 is -48.81% vs 8,300.00% in Sep 2024
Growth in half year ended Sep 2025 is -57.57% vs -399.24% in Sep 2024
Nine Monthly Results Snapshot (Consolidated) - Dec'25
YoY Growth in nine months ended Dec 2025 is -37.74% vs 1,897.44% in Dec 2024
YoY Growth in nine months ended Dec 2025 is -27.45% vs -221.21% in Dec 2024
Annual Results Snapshot (Consolidated) - Mar'26
YoY Growth in year ended Mar 2026 is 174.13% vs 40.00% in Mar 2025
YoY Growth in year ended Mar 2026 is -60.37% vs 48.50% in Mar 2025
About Deccan Gold Mines Ltd

Company Coordinates


