
Compare Deepak Fertilis. with Similar Stocks
Stock DNA
Fertilizers
INR 20,151 Cr (Small Cap)
27.00
23
0.62%
0.73
10.77%
2.96
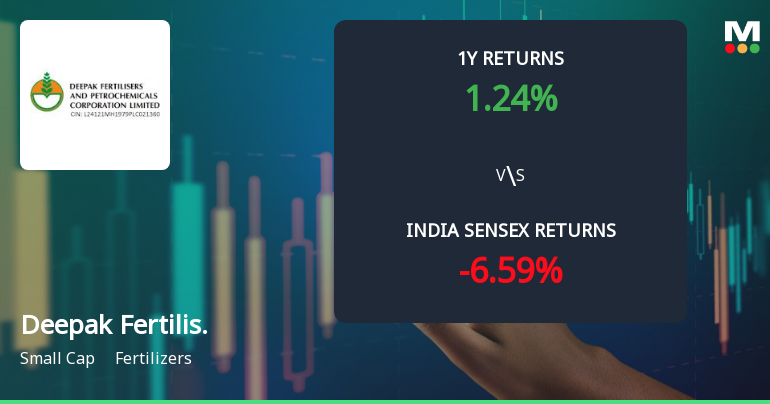
Total Returns (Price + Dividend) 
Latest dividend: 10 per share ex-dividend date: Sep-02-2025
Risk Adjusted Returns v/s
Returns Beta

News
Deepak Fertilisers & Petrochemicals Corp Ltd Shows Bullish Momentum Amid Technical Upgrades
Deepak Fertilisers & Petrochemicals Corp Ltd has demonstrated a notable shift in price momentum, supported by a series of bullish technical indicators and an upgraded rating from MarketsMOJO. The stock’s recent performance outpaces the broader market, signalling renewed investor confidence amid a favourable technical backdrop.
Read full news article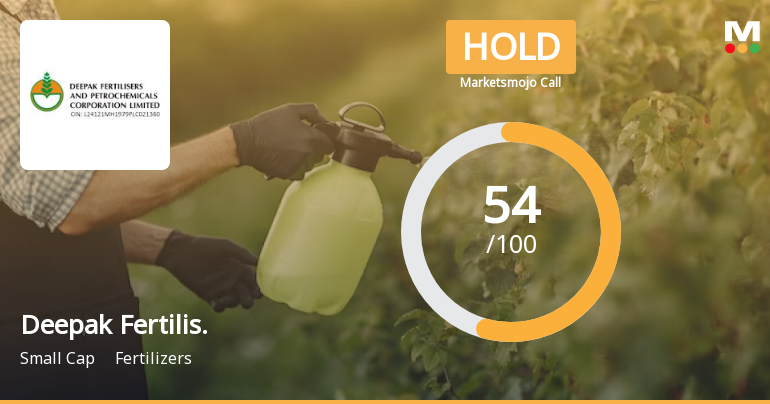
Deepak Fertilisers & Petrochemicals Corp Ltd is Rated Hold
Deepak Fertilisers & Petrochemicals Corp Ltd is rated 'Hold' by MarketsMOJO, with this rating last updated on 10 June 2026. However, the analysis and financial metrics presented here reflect the company’s current position as of 14 July 2026, providing investors with the most recent and relevant data to assess the stock’s outlook.
Read full news article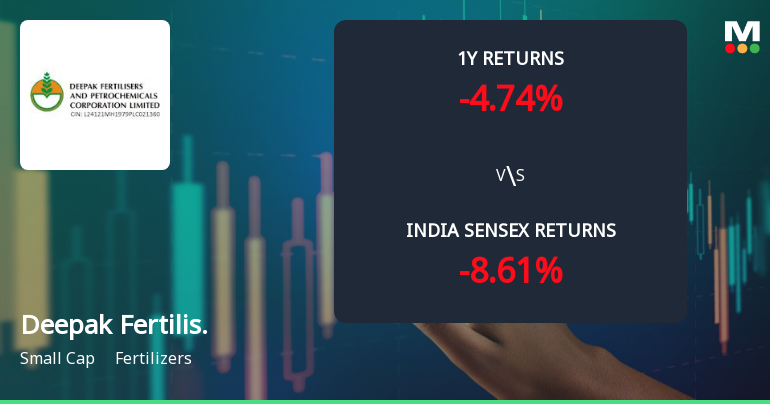
Deepak Fertilisers & Petrochemicals Corp Ltd: Technical Momentum Shifts Amid Mixed Signals
Deepak Fertilisers & Petrochemicals Corp Ltd (DFPCL) has experienced a notable shift in its technical momentum, reflecting a complex interplay of bullish and bearish signals across multiple timeframes. Despite a recent downgrade in daily price performance, the stock’s longer-term returns continue to outpace the broader Sensex, signalling a nuanced outlook for investors in the fertilizers sector.
Read full news article Announcements
Compliances-Certificate under Reg. 74 (5) of SEBI (DP) Regulations 2018
10-Jul-2026 | Source : BSECertificate under Regulation 74(5) of the SEBI (Depositories and Participants) Regulations 2018
Disclosures under Reg. 31(1) and 31(2) of SEBI (SAST) Regulations 2011
09-Jul-2026 | Source : BSEThe Exchange has received Disclosure under Regulation 31(1) and 31(2) of SEBI (Substantial Acquisition of Shares & Takeovers) Regulations 2011 on July 09 2026 for Robust Marketing Services Pvt Ltd
Announcement under Regulation 30 (LODR)-Newspaper Publication
07-Jul-2026 | Source : BSEIntimation of newspaper publication under Regulation 30 of the SEBI (Listing Obligations and Disclosure Requirements) Regulations 2015
Corporate Actions

No Upcoming Board Meetings

Deepak Fertilisers & Petrochemicals Corp Ltd has declared 100% dividend, ex-date: 02 Sep 25

No Splits history available

No Bonus history available

Deepak Fertilisers & Petrochemicals Corp Ltd has announced 3:20 rights issue, ex-date: 16 Sep 20
Quality key factors
Valuation key factors
Technicals key factors
 Technical Indicator Scale: Bearish, Mildly Bearish, Sideways, Mildly Bullish, Bullish Turned
 Shareholding Snapshot : Mar 2026
Shareholding Compare (%holding)
Promoters
5.0431
Held by 21 Schemes (9.58%)
Held by 141 FIIs (10.31%)
Nova Synthetic Private Limited (34.53%)
Sbi Small Cap Fund (5.25%)
24.27%
Quarterly Results Snapshot (Consolidated) - Mar'26 - QoQ

QoQ Growth in quarter ended Mar 2026 is 6.41% vs -5.85% in Dec 2025
QoQ Growth in quarter ended Mar 2026 is -1.48% vs -33.64% in Dec 2025
Half Yearly Results Snapshot (Consolidated) - Sep'25
Growth in half year ended Sep 2025 is 12.66% vs 6.14% in Sep 2024

Growth in half year ended Sep 2025 is 12.51% vs 138.39% in Sep 2024
Nine Monthly Results Snapshot (Consolidated) - Dec'25
YoY Growth in nine months ended Dec 2025 is 11.67% vs 15.44% in Dec 2024
YoY Growth in nine months ended Dec 2025 is -8.91% vs 188.23% in Dec 2024
Annual Results Snapshot (Consolidated) - Mar'26
YoY Growth in year ended Mar 2026 is 11.99% vs 18.42% in Mar 2025
YoY Growth in year ended Mar 2026 is -21.03% vs 106.16% in Mar 2025
About Deepak Fertilisers & Petrochemicals Corp Ltd

Company Coordinates


