
Compare Delphi World with Similar Stocks
Stock DNA
Non Banking Financial Company (NBFC)
INR 206 Cr (Micro Cap)
41.00
20
0.00%
0.53
0.95%
0.61
Total Returns (Price + Dividend) 
Latest dividend: 1 per share ex-dividend date: Jul-30-2018
Risk Adjusted Returns v/s
Returns Beta

News
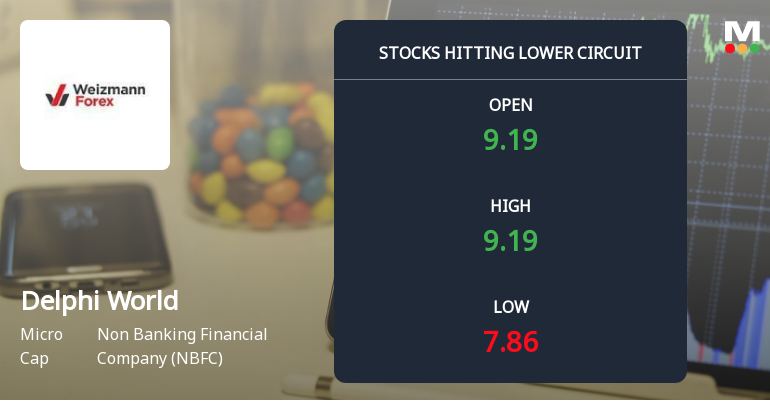
Below All Moving Averages and Now at Lower Circuit: Delphi World Money Ltd Loses 7.79% in a Single Session
At Rs 7.29, sellers were still queuing — but there were no buyers willing to take the other side. Delphi World Money Ltd locked at its lower circuit of 7.79% on 10 Jun 2026, with unfilled sell orders and a frozen price, signalling a pronounced imbalance in supply and demand.
Read full news article
Delphi World Money Ltd Upgraded to Sell on Technical and Valuation Improvements
Delphi World Money Ltd, a micro-cap player in the Non Banking Financial Company (NBFC) sector, has seen its investment rating upgraded from Strong Sell to Sell as of 9 June 2026. This change reflects a nuanced improvement across technical indicators and valuation metrics, despite ongoing challenges in financial performance and quality parameters.
Read full news article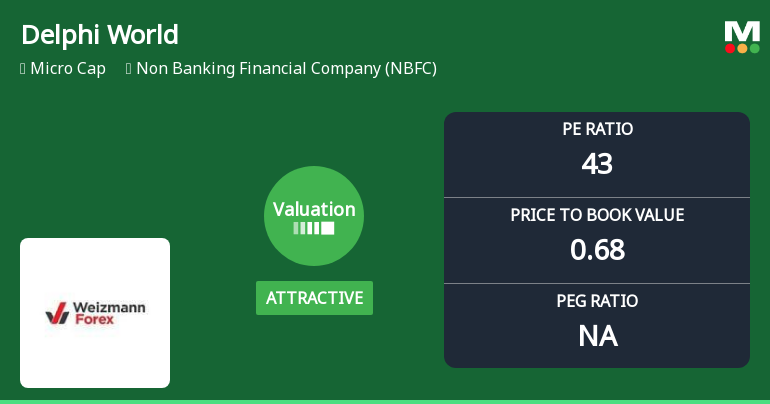
Delphi World Money Ltd Valuation Shifts Signal Renewed Price Attractiveness Amid Market Challenges
Delphi World Money Ltd, a micro-cap player in the Non Banking Financial Company (NBFC) sector, has seen a notable shift in its valuation parameters, moving from fair to attractive territory. Despite a recent downgrade in its overall Mojo Grade to Strong Sell, the company’s price-to-earnings (P/E) and price-to-book value (P/BV) ratios suggest a potential reappraisal of its price attractiveness compared to historical and peer benchmarks.
Read full news article Announcements
Announcement under Regulation 30 (LODR)-Press Release / Media Release
03-Jun-2026 | Source : BSEMedia Release titled Dwarka Commercial Court Returns Plaint; Status Quo Order vacated; Delphis Consistent Position on Jurisdiction Stands Vindicated
Media Release Titled Dwarka Commercial Court Returns Plaint; Status Quo Order Vacated; Delphis Consistent Position On Jurisdiction Stands Vindicated
03-Jun-2026 | Source : BSEPlease find attached herewith
Announcement under Regulation 30 (LODR)-Press Release / Media Release
03-Jun-2026 | Source : BSEDisclosure under Regulation 30 of the SEBI (LODR) Regulations 2015
Corporate Actions

No Upcoming Board Meetings

Delphi World Money Ltd has declared 10% dividend, ex-date: 30 Jul 18

Delphi World Money Ltd has announced 2:10 stock split, ex-date: 13 Feb 26

Delphi World Money Ltd has announced 2:1 bonus issue, ex-date: 13 Feb 26

Delphi World Money Ltd has announced 23:49 rights issue, ex-date: 14 Oct 25
Quality key factors
Valuation key factors
Technicals key factors
 Technical Indicator Scale: Bearish, Mildly Bearish, Sideways, Mildly Bullish, Bullish Turned
 Shareholding Snapshot : Mar 2026
Shareholding Compare (%holding)
Promoters
None
Held by 0 Schemes
Held by 4 FIIs (0.02%)
Ebixcash World Money Limited (61.32%)
Gi Engineering Solutions Limited (4.19%)
22.7%
Quarterly Results Snapshot (Standalone) - Mar'26 - YoY

YoY Growth in quarter ended Mar 2026 is -78.26% vs -19.02% in Mar 2025
YoY Growth in quarter ended Mar 2026 is -162.02% vs -16.33% in Mar 2025
Half Yearly Results Snapshot (Standalone) - Sep'25

Growth in half year ended Sep 2025 is -31.77% vs -67.86% in Sep 2024
Growth in half year ended Sep 2025 is 91.96% vs -55.70% in Sep 2024
Nine Monthly Results Snapshot (Standalone) - Dec'25
YoY Growth in nine months ended Dec 2025 is -48.14% vs -59.09% in Dec 2024
YoY Growth in nine months ended Dec 2025 is 452.38% vs -117.86% in Dec 2024
Annual Results Snapshot (Consolidated) - Mar'26
Not Applicable: The company has declared_date for only one period
Not Applicable: The company has declared_date for only one period
About Delphi World Money Ltd

Company Coordinates


