
Compare Delta Manufact. with Similar Stocks
Dashboard
With HIgh Debt (Debt-Equity Ratio at 17.13 times)- the company has a Weak Long Term Fundamental Strength
- Low ability to service debt as the company has a high Debt to EBITDA ratio of 13.23 times
- The company has been able to generate a Return on Equity (avg) of 0.20% signifying low profitability per unit of shareholders funds
With ROCE of 0.2, it has a Expensive valuation with a 2.5 Enterprise value to Capital Employed
Consistent Underperformance against the benchmark over the last 3 years
Stock DNA
Other Industrial Products
INR 67 Cr (Micro Cap)
NA (Loss Making)
38
0.00%
17.13
-122.17%
27.43
Total Returns (Price + Dividend) 
Delta Manufact. for the last several years.
Risk Adjusted Returns v/s
Returns Beta

News

Delta Manufacturing Ltd is Rated Strong Sell
Delta Manufacturing Ltd is rated Strong Sell by MarketsMOJO. This rating was last updated on 15 Sep 2025. However, the analysis and financial metrics discussed below reflect the company’s current position as of 10 July 2026, providing investors with an up-to-date view of the stock’s fundamentals, valuation, financial trends, and technical outlook.
Read full news article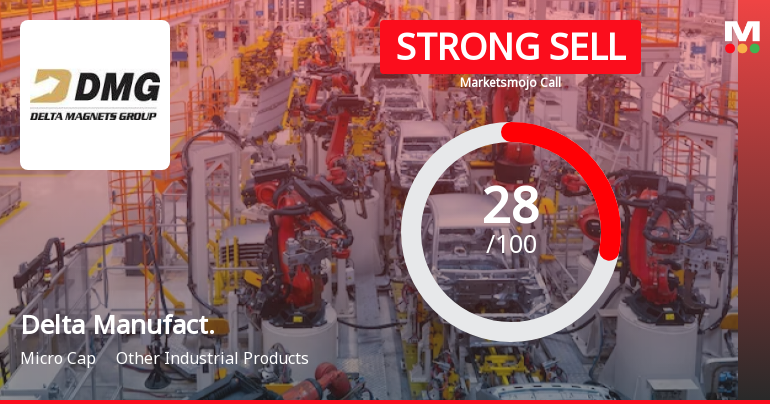
Delta Manufacturing Ltd is Rated Strong Sell
Delta Manufacturing Ltd is rated Strong Sell by MarketsMOJO. This rating was last updated on 15 Sep 2025. However, the analysis and financial metrics discussed below reflect the company’s current position as of 29 June 2026, providing investors with an up-to-date view of the stock’s fundamentals, returns, and technical outlook.
Read full news article
Delta Manufacturing Ltd is Rated Strong Sell
Delta Manufacturing Ltd is rated Strong Sell by MarketsMOJO. This rating was last updated on 15 Sep 2025, reflecting a shift from the previous 'Sell' grade. However, the analysis and financial metrics discussed here are based on the company's current position as of 17 June 2026, providing investors with the latest insights into the stock's performance and outlook.
Read full news article Announcements
Compliances-Certificate under Reg. 74 (5) of SEBI (DP) Regulations 2018
08-Jul-2026 | Source : BSECertificate under Reg 74 (5) of SEBI (DP) Regulations.
Disclosure Under Regulation 30
03-Jul-2026 | Source : BSEDisclosure under regulation 30
Disclosure Under Regulation 30
11-Jun-2026 | Source : BSEDisclosure under regulation 30
Corporate Actions

No Upcoming Board Meetings

No Dividend history available

No Splits history available

No Bonus history available

No Rights history available
Quality key factors
Valuation key factors
Technicals key factors
 Technical Indicator Scale: Bearish, Mildly Bearish, Sideways, Mildly Bullish, Bullish Turned
 Shareholding Snapshot : Mar 2026
Shareholding Compare (%holding)
Promoters
None
Held by 3 Schemes (0.01%)
Held by 0 FIIs
Aditi Mody Family Private Limited (18.31%)
None
23.68%
Quarterly Results Snapshot (Consolidated) - Mar'26 - QoQ

QoQ Growth in quarter ended Mar 2026 is 19.06% vs 12.54% in Dec 2025
QoQ Growth in quarter ended Mar 2026 is 49.62% vs -115.77% in Dec 2025
Half Yearly Results Snapshot (Consolidated) - Sep'25
Growth in half year ended Sep 2025 is -5.60% vs -27.85% in Sep 2024
Growth in half year ended Sep 2025 is 21.81% vs -16.47% in Sep 2024
Nine Monthly Results Snapshot (Consolidated) - Dec'25
YoY Growth in nine months ended Dec 2025 is -2.57% vs -23.24% in Dec 2024
YoY Growth in nine months ended Dec 2025 is 16.47% vs -57.10% in Dec 2024
Annual Results Snapshot (Consolidated) - Mar'26
YoY Growth in year ended Mar 2026 is 10.80% vs -17.24% in Mar 2025
YoY Growth in year ended Mar 2026 is -2.65% vs -16.36% in Mar 2025
About Delta Manufacturing Ltd

Company Coordinates


