
Compare Den Networks with Similar Stocks
Dashboard
Poor Management Efficiency with a low ROE of 5.94%
- The company has been able to generate a Return on Equity (avg) of 5.94% signifying low profitability per unit of shareholders funds
Poor long term growth as Net Sales has grown by an annual rate of -5.71% and Operating profit at -232.42% over the last 5 years
The company has declared Negative results for the last 4 consecutive quarters
Risky - Negative Operating Profits
Despite the size of the company, domestic mutual funds hold only 0% of the company
Below par performance in long term as well as near term
Stock DNA
Media & Entertainment
INR 1,288 Cr (Micro Cap)
8.00
14
0.00%
-0.86
4.38%
0.33
Total Returns (Price + Dividend) 
Den Networks for the last several years.
Risk Adjusted Returns v/s
Returns Beta

News

Den Networks Ltd Faces Intensified Downtrend Amid Technical Momentum Shift
Den Networks Ltd has experienced a notable shift in its technical momentum, with key indicators signalling a transition from mildly bearish to a more pronounced bearish trend. Despite some mildly bullish signals on weekly charts, the overall technical landscape remains challenging for this micro-cap media and entertainment stock, which continues to underperform relative to the broader market benchmarks.
Read full news article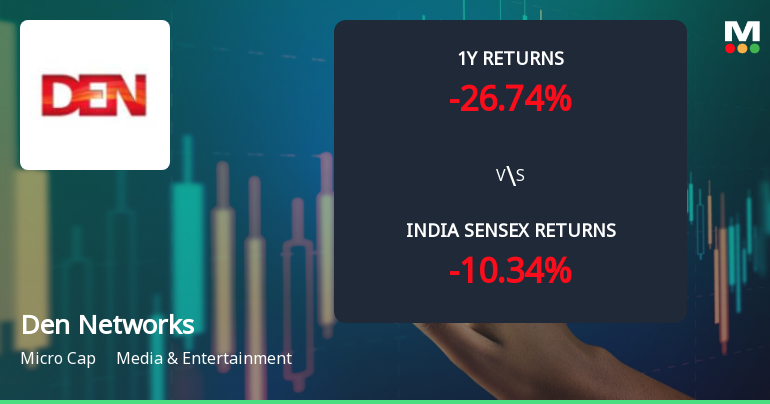
Den Networks Ltd Technical Momentum Shifts Amid Persistent Downtrend
Den Networks Ltd has experienced a subtle shift in its technical momentum, moving from a bearish to a mildly bearish trend, as reflected in its recent price action and technical indicators. Despite a modest day gain of 0.63%, the stock remains under pressure with a strong sell rating and a micro-cap market classification, signalling caution for investors amid mixed signals from key momentum oscillators.
Read full news article
Den Networks Ltd is Rated Strong Sell
Den Networks Ltd is rated Strong Sell by MarketsMOJO. This rating was last updated on 30 September 2025. However, the analysis and financial metrics discussed below reflect the stock’s current position as of 08 June 2026, providing investors with the latest insights into the company’s performance and outlook.
Read full news article Announcements
Compliances-Reg.24(A)-Annual Secretarial Compliance
20-May-2026 | Source : BSEThe Annual Secretarial Compliance Report for the financial year ended March 31 2026 is attached
Newspaper Clippings - Special Window For Transfer And Dematerialisation (Demat) Of Physical Shares
16-Apr-2026 | Source : BSENewspaper clippings - Special Window for transfer and dematerialisation (demat) of physical shares
Investor Presentation
14-Apr-2026 | Source : BSEInvestor Presentation
Corporate Actions

No Upcoming Board Meetings

No Dividend history available

No Splits history available

No Bonus history available

No Rights history available
Quality key factors
Valuation key factors
Technicals key factors
 Technical Indicator Scale: Bearish, Mildly Bearish, Sideways, Mildly Bullish, Bullish Turned
 Shareholding Snapshot : Mar 2026
Shareholding Compare (%holding)
Promoters
None
Held by 1 Schemes (0.0%)
Held by 19 FIIs (0.45%)
Jio Futuristic Digital Holdings Private Limited (35.94%)
None
19.51%
Quarterly Results Snapshot (Consolidated) - Mar'26 - QoQ

QoQ Growth in quarter ended Mar 2026 is -4.16% vs 3.97% in Dec 2025
QoQ Growth in quarter ended Mar 2026 is 1.08% vs 8.05% in Dec 2025
Half Yearly Results Snapshot (Consolidated) - Sep'25

Growth in half year ended Sep 2025 is -2.80% vs -9.67% in Sep 2024
Growth in half year ended Sep 2025 is -8.39% vs 10.49% in Sep 2024
Nine Monthly Results Snapshot (Consolidated) - Dec'25
YoY Growth in nine months ended Dec 2025 is -3.12% vs -7.95% in Dec 2024
YoY Growth in nine months ended Dec 2025 is -7.62% vs 1.69% in Dec 2024
Annual Results Snapshot (Consolidated) - Mar'26
YoY Growth in year ended Mar 2026 is -3.10% vs -6.97% in Mar 2025
YoY Growth in year ended Mar 2026 is -17.14% vs -6.80% in Mar 2025
About Den Networks Ltd

Company Coordinates


