
Compare Denis Chem Lab with Similar Stocks
Stock DNA
Pharmaceuticals & Biotechnology
INR 102 Cr (Micro Cap)
12.00
36
2.07%
-0.27
9.18%
1.10
Total Returns (Price + Dividend) 
Latest dividend: 1.5 per share ex-dividend date: Sep-19-2025
Risk Adjusted Returns v/s
Returns Beta

News
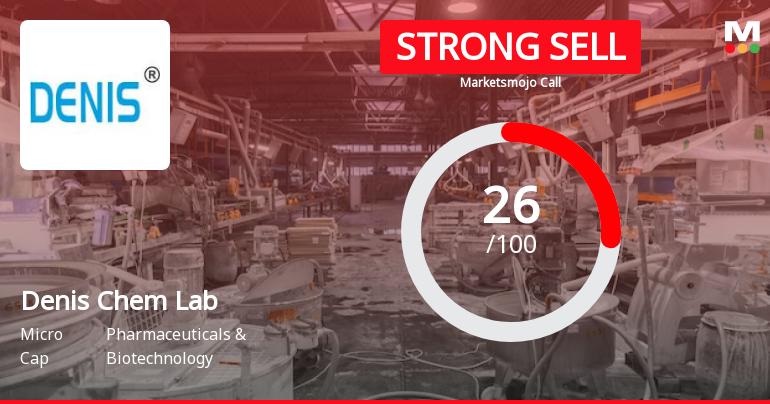
Denis Chem Lab Ltd is Rated Strong Sell
Denis Chem Lab Ltd is rated Strong Sell by MarketsMOJO. This rating was last updated on 01 June 2026, reflecting a reassessment of the stock’s outlook. However, all fundamentals, returns, and financial metrics discussed here are current as of 02 June 2026, providing investors with the latest perspective on the company’s position.
Read full news article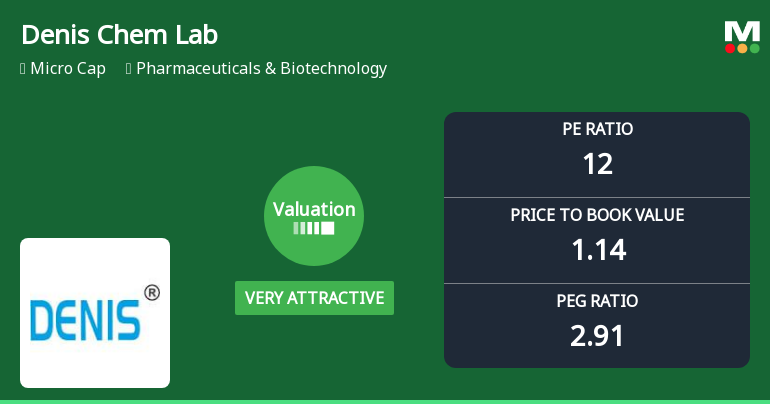
Denis Chem Lab Ltd Valuation Shifts to Very Attractive Amid Market Challenges
Denis Chem Lab Ltd, a micro-cap player in the Pharmaceuticals & Biotechnology sector, has seen a notable shift in its valuation parameters, moving from an attractive to a very attractive rating. Despite recent share price declines and a challenging market backdrop, the company’s price-to-earnings (P/E) and price-to-book value (P/BV) ratios now present compelling value compared to peers and historical averages.
Read full news article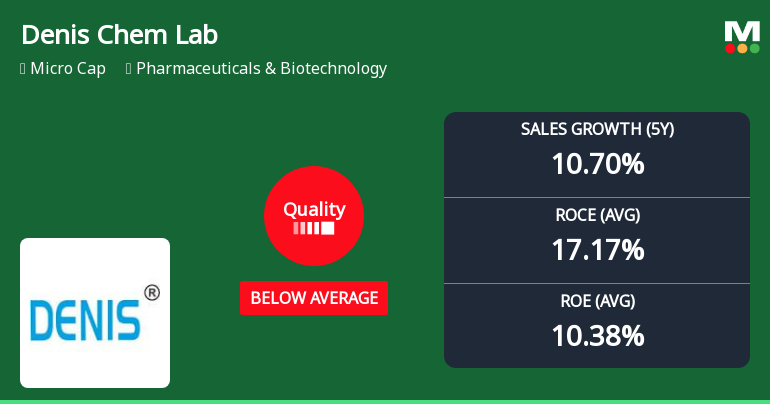
Denis Chem Lab Ltd Downgraded to Below Average Quality Amidst Declining Returns and Margins
Denis Chem Lab Ltd, a micro-cap player in the Pharmaceuticals & Biotechnology sector, has seen its quality grading slip from average to below average, prompting a downgrade in its Mojo Grade from Sell to Strong Sell as of 25 Feb 2026. This shift reflects a deterioration in key business fundamentals, including returns on equity and capital employed, as well as concerns over growth consistency and leverage metrics.
Read full news article Announcements
Board Meeting Outcome for Outcome Of Board Meeting - Submission Of Audited Financial Results For The Financial Year Ended On 31St March 2026 & Other Intimations
30-May-2026 | Source : BSEthe Board of Directors of the Company in their meeting held today i.e. on 30th May 2026 interalia has: 1. Approved the Standalone Audited Financial Statements of the Company for Quarter and Financial Year ended on 31st March 2026 as recommended by the Audit Committee. 2. Recommended a Final dividend of Rs. 2.50 per Equity Share of Rs.10/- each for the financial year 2025-26 ended on 31st March 2026 subject to approval of shareholders/members at the ensuing Annual General Meeting. 3. Considered and approved the appointment of M/s. Kashyap R. Mehta & Partners Company Secretaries Ahmedabad (FRN: P2025GJ106000) (Peer Review Number: 6827/2025) as the Secretarial Auditors of the Company . 4. Considered and approved the appointment of M/s. Kiran J. Mehta & Co. Cost Accountants Ahmedabad (Firm Registration No. 000025) as Cost Auditors of the Company for the FY 2026-27.
Corporate Action-Board approves Dividend
30-May-2026 | Source : BSEThe Board of Directors in their meeting held today recommended a final dividend of Rs. 2.5/- (@25%) per equity share of Rs. 10/- each for the financial year 2025-26 subject to approval of shareholders in Annual General Meeting.
Results - Financial Results For 31St March 2026.
30-May-2026 | Source : BSEAudited Financial Results for financial year ended on 31st March 2026 along with Auditors report thereon.
Corporate Actions

No Upcoming Board Meetings

Denis Chem Lab Ltd has declared 15% dividend, ex-date: 19 Sep 25

No Splits history available

No Bonus history available

Denis Chem Lab Ltd has announced 2:11 rights issue, ex-date: 07 Sep 17
Quality key factors
Valuation key factors
Technicals key factors
 Technical Indicator Scale: Bearish, Mildly Bearish, Sideways, Mildly Bullish, Bullish Turned
 Shareholding Snapshot : Mar 2026
Shareholding Compare (%holding)
Non Institution
None
Held by 0 Schemes
Held by 1 FIIs (0.01%)
Anar Himanshu Patel (21.7%)
V-s Holding B.v. (20.74%)
28.93%
Quarterly Results Snapshot (Standalone) - Mar'26 - QoQ

QoQ Growth in quarter ended Mar 2026 is 2.70% vs -1.41% in Dec 2025

QoQ Growth in quarter ended Mar 2026 is -87.95% vs 50.23% in Dec 2025
Half Yearly Results Snapshot (Standalone) - Sep'25
Growth in half year ended Sep 2025 is 0.42% vs -46.92% in Sep 2024
Growth in half year ended Sep 2025 is -16.40% vs -49.73% in Sep 2024
Nine Monthly Results Snapshot (Standalone) - Dec'25
YoY Growth in nine months ended Dec 2025 is 2.31% vs 3.09% in Dec 2024
YoY Growth in nine months ended Dec 2025 is 8.68% vs -12.57% in Dec 2024
Annual Results Snapshot (Standalone) - Mar'26
YoY Growth in year ended Mar 2026 is 4.86% vs 3.27% in Mar 2025
YoY Growth in year ended Mar 2026 is 4.08% vs -27.60% in Mar 2025
About Denis Chem Lab Ltd

Company Coordinates


