
Compare Denta Water with Similar Stocks
Dashboard
Poor long term growth as Operating profit has grown by an annual rate -3.04% of over the last 5 years
Negative results in Mar 26
With ROE of 13.3, it has a Expensive valuation with a 1.9 Price to Book Value
Despite the size of the company, domestic mutual funds hold only 0% of the company
Stock DNA
Other Utilities
INR 867 Cr (Micro Cap)
14.00
39
0.76%
-0.17
13.27%
1.92
Total Returns (Price + Dividend) 
Latest dividend: 2.514852220406951 per share ex-dividend date: Aug-14-2025
Risk Adjusted Returns v/s
Returns Beta

News
Denta Water & Infra Solutions Ltd is Rated Sell
Denta Water & Infra Solutions Ltd is rated 'Sell' by MarketsMOJO, with this rating last updated on 13 February 2026. However, the analysis and financial metrics presented here reflect the stock's current position as of 13 July 2026, providing investors with an up-to-date view of the company’s fundamentals, returns, and market standing.
Read full news article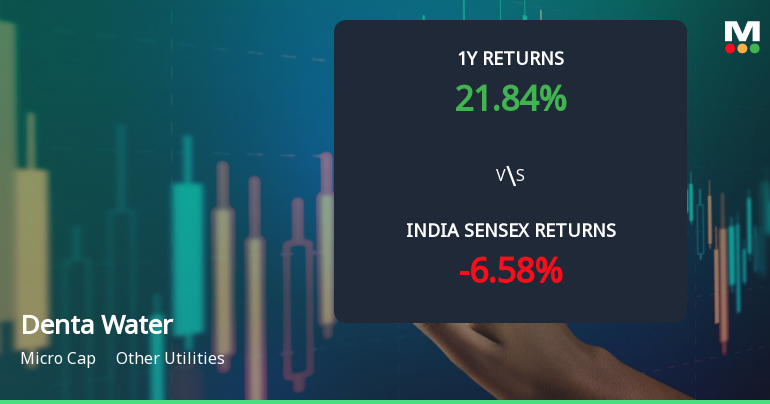
Denta Water & Infra Solutions Ltd Shows Mildly Bullish Momentum Amid Technical Shift
Denta Water & Infra Solutions Ltd has exhibited a notable shift in price momentum, transitioning from a sideways trend to a mildly bullish stance as of early July 2026. Despite a micro-cap market cap and a modest Mojo Score of 44.0, the stock’s technical indicators reveal a nuanced picture of emerging strength, with key oscillators and moving averages signalling potential upside tempered by some bearish elements.
Read full news article
Denta Water & Infra Solutions Ltd is Rated Sell
Denta Water & Infra Solutions Ltd is rated 'Sell' by MarketsMOJO, with this rating last updated on 13 February 2026. However, the analysis and financial metrics discussed here reflect the stock's current position as of 02 July 2026, providing investors with an up-to-date view of the company’s fundamentals, valuation, financial trends, and technical outlook.
Read full news article Announcements
Compliances-Certificate under Reg. 74 (5) of SEBI (DP) Regulations 2018
07-Jul-2026 | Source : BSECertificate under Reg. 74(5) of SEBI(DP) Regulations 2018
Announcement under Regulation 30 (LODR)-Analyst / Investor Meet - Outcome
29-Jun-2026 | Source : BSETranscript of the Q4 and FY26 Earnings Conference Call
Closure of Trading Window
26-Jun-2026 | Source : BSETrading window for dealing in the Companys share will be closed for all the designated persons their immediate relatives and other Insiders of the company from July 1 2026.
Corporate Actions

No Upcoming Board Meetings

Denta Water & Infra Solutions Ltd has declared 25% dividend, ex-date: 14 Aug 25

No Splits history available

No Bonus history available

No Rights history available
Quality key factors
Valuation key factors
Technicals key factors
 Technical Indicator Scale: Bearish, Mildly Bearish, Sideways, Mildly Bullish, Bullish Turned
 Shareholding Snapshot : Jun 2026
Shareholding Compare (%holding)
Promoters
None
Held by 0 Schemes
Held by 1 FIIs (0.0%)
Sowbhagyamma (25.17%)
None
24.63%
Quarterly Results Snapshot (Consolidated) - Mar'26 - QoQ

QoQ Growth in quarter ended Mar 2026 is 3.34% vs -27.94% in Dec 2025

QoQ Growth in quarter ended Mar 2026 is -36.34% vs -24.41% in Dec 2025
Half Yearly Results Snapshot (Standalone) - Sep'25
Not Applicable: The company has declared_date for only one period
Not Applicable: The company has declared_date for only one period
Nine Monthly Results Snapshot (Standalone) - Dec'25
Not Applicable: The company has declared_date for only one period
Not Applicable: The company has declared_date for only one period
Annual Results Snapshot (Consolidated) - Mar'26
YoY Growth in year ended Mar 2026 is 23.16% vs -14.80% in Mar 2025
YoY Growth in year ended Mar 2026 is 15.14% vs -12.54% in Mar 2025
About Denta Water & Infra Solutions Ltd

Company Coordinates


