
Compare Dhampur Sugar with Similar Stocks
Dashboard
Weak Long Term Fundamental Strength with a -19.06% CAGR growth in Operating Profits over the last 5 years
- Low ability to service debt as the company has a high Debt to EBITDA ratio of 5.19 times
Positive results in Mar 26
With ROCE of 6.1, it has a Attractive valuation with a 0.9 Enterprise value to Capital Employed
Increasing Participation by Institutional Investors
Total Returns (Price + Dividend) 
Latest dividend: 2 per share ex-dividend date: May-26-2026
Risk Adjusted Returns v/s
Returns Beta

News

Dhampur Sugar Mills Ltd Technical Momentum Shifts Amid Mixed Market Signals
Dhampur Sugar Mills Ltd has experienced a nuanced shift in its technical momentum, moving from a bullish stance to a mildly bullish outlook as of early June 2026. Despite a recent downgrade in its Mojo Grade from Buy to Hold, the stock continues to exhibit mixed signals across key technical indicators, reflecting a complex interplay of price momentum and market sentiment within the sugar sector.
Read full news article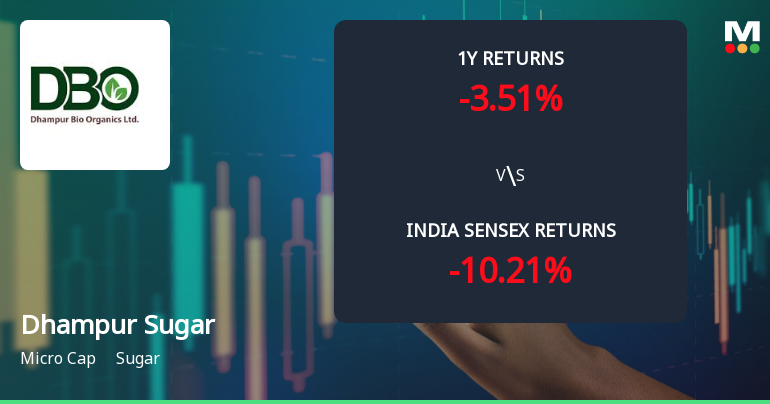
Dhampur Sugar Mills Ltd Technical Momentum Shifts to Bullish Amid Mixed Returns
Dhampur Sugar Mills Ltd has experienced a notable shift in its technical momentum, moving from a mildly bullish stance to a more confident bullish trend. This change is underscored by a combination of technical indicators including MACD, RSI, moving averages, and Bollinger Bands, signalling a potential positive trajectory despite mixed returns relative to the broader Sensex index.
Read full news article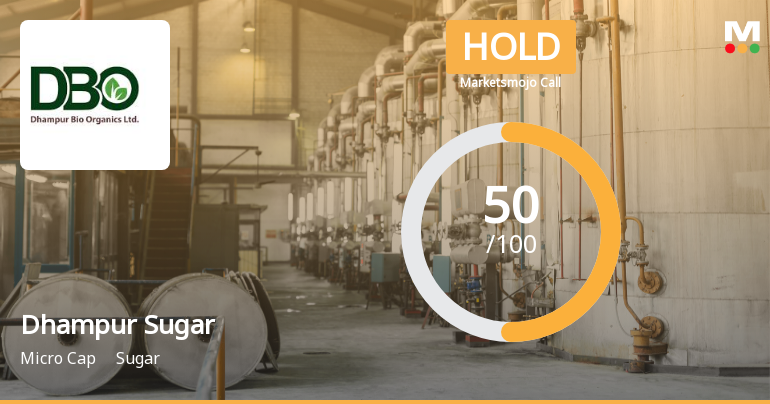
Dhampur Sugar Mills Ltd Downgraded to Hold Amid Mixed Financial and Technical Signals
Dhampur Sugar Mills Ltd has seen its investment rating downgraded from Buy to Hold as of 1 June 2026, reflecting a nuanced shift in its quality, valuation, financial trend, and technical parameters. Despite attractive valuation metrics and recent positive quarterly earnings, concerns over deteriorating long-term fundamentals and subdued technical momentum have tempered investor enthusiasm.
Read full news article Announcements
Announcement under Regulation 30 (LODR)-Newspaper Publication
29-May-2026 | Source : BSEPlease find attached newspaper advertisement.
Submission Of Communication Sent To Shareholders
22-May-2026 | Source : BSEPlease find attached communication sent to shareholders.
Board Meeting Intimation for Intimation Of Board Meeting
21-May-2026 | Source : BSEDhampur Sugar Mills Ltdhas informed BSE that the meeting of the Board of Directors of the Company is scheduled on 28/05/2026 inter alia to consider and approve Please find attached intimation of board meeting.
Corporate Actions

No Upcoming Board Meetings

Dhampur Sugar Mills Ltd has declared 20% dividend, ex-date: 26 May 26

No Splits history available

No Bonus history available

No Rights history available
Quality key factors
Valuation key factors
Technicals key factors
 Technical Indicator Scale: Bearish, Mildly Bearish, Sideways, Mildly Bullish, Bullish Turned
 Shareholding Snapshot : Mar 2026
Shareholding Compare (%holding)
Promoters
None
Held by 5 Schemes (0.0%)
Held by 28 FIIs (2.41%)
Goel Investments Ltd (28.0%)
None
40.22%
Quarterly Results Snapshot (Consolidated) - Mar'26 - QoQ

QoQ Growth in quarter ended Mar 2026 is 8.75% vs -10.51% in Dec 2025

QoQ Growth in quarter ended Mar 2026 is 72.29% vs 436.17% in Dec 2025
Half Yearly Results Snapshot (Consolidated) - Sep'25
Growth in half year ended Sep 2025 is 10.82% vs -25.52% in Sep 2024
Growth in half year ended Sep 2025 is 41.02% vs -123.50% in Sep 2024
Nine Monthly Results Snapshot (Consolidated) - Dec'25
YoY Growth in nine months ended Dec 2025 is 10.42% vs -16.79% in Dec 2024
YoY Growth in nine months ended Dec 2025 is 508.12% vs -96.12% in Dec 2024
Annual Results Snapshot (Consolidated) - Mar'26
YoY Growth in year ended Mar 2026 is 0.56% vs -9.79% in Mar 2025
YoY Growth in year ended Mar 2026 is 24.69% vs -61.13% in Mar 2025
About Dhampur Sugar Mills Ltd

Company Coordinates


