
Compare Avadh Sugar with Similar Stocks
Dashboard
Weak Long Term Fundamental Strength with a -5.43% CAGR growth in Operating Profits over the last 5 years
- Low ability to service debt as the company has a high Debt to EBITDA ratio of 6.36 times
- The company has been able to generate a Return on Capital Employed (avg) of 9.94% signifying low profitability per unit of total capital (equity and debt)
- PBT LESS OI(Q) At Rs 82.65 cr has Fallen at -25.24%
- PAT(Q) At Rs 55.03 cr has Fallen at -23.2%
- ROCE(HY) Lowest at 6.50%
Falling Participation by Institutional Investors
Total Returns (Price + Dividend) 
Latest dividend: 10 per share ex-dividend date: Jul-16-2025
Risk Adjusted Returns v/s
Returns Beta

News
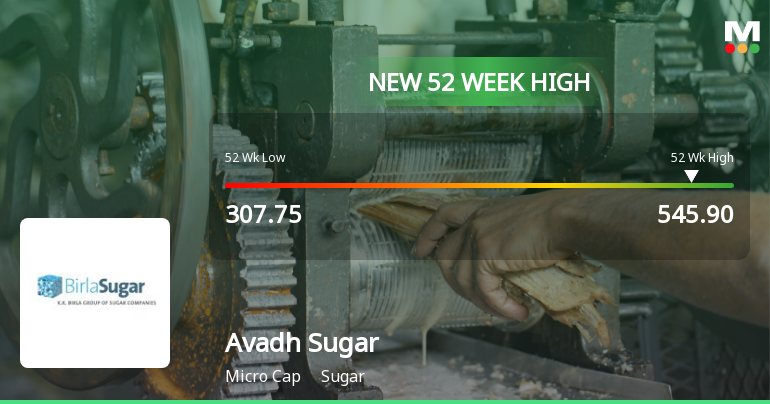
Broad-Based Technical Strength Lifts Avadh Sugar & Energy Ltd to 52-Week High of Rs 545.9
With a decisive break above Rs 545.9 on 14 Jul 2026, Avadh Sugar & Energy Ltd has reached a fresh 52-week high, marking a notable milestone in its price momentum. This advance comes amid a four-day winning streak that has propelled the stock up by over 7% in that period, despite a broader market that is trading lower.
Read full news article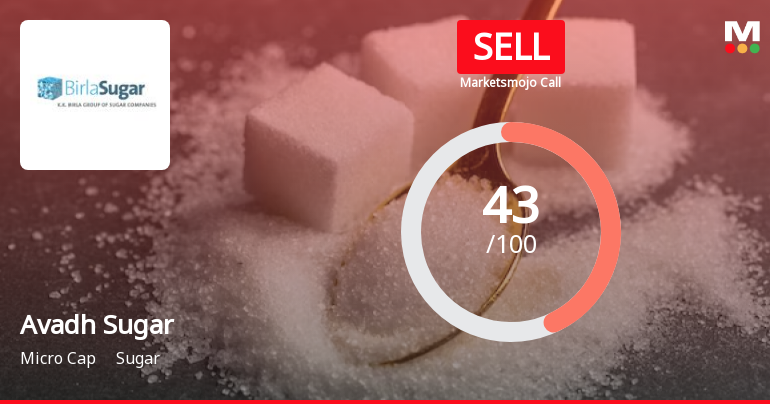
Avadh Sugar & Energy Ltd is Rated Sell
Avadh Sugar & Energy Ltd is rated 'Sell' by MarketsMOJO, with this rating last updated on 30 June 2026. However, the analysis and financial metrics discussed here reflect the stock's current position as of 12 July 2026, providing investors with the latest insights into the company’s performance and outlook.
Read full news article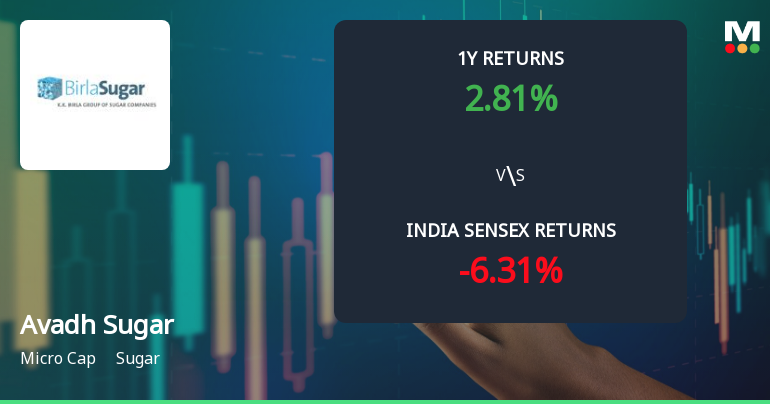
Avadh Sugar & Energy Ltd Shows Technical Momentum Shift Amid Mixed Market Returns
Avadh Sugar & Energy Ltd has witnessed a notable shift in its technical momentum, moving from a mildly bullish stance to a more confident bullish trend. Despite a recent dip in price, key technical indicators such as MACD, moving averages, and Bollinger Bands signal improving momentum, suggesting potential opportunities for investors amid a challenging micro-cap environment.
Read full news article Announcements
Announcement under Regulation 30 (LODR)-Newspaper Publication
08-Jul-2026 | Source : BSECopy of Newspaper Publication
Compliances-Certificate under Reg. 74 (5) of SEBI (DP) Regulations 2018
08-Jul-2026 | Source : BSECertificate under Regulation 74(5) of SEBI (DP) Regulations 2018
Announcement under Regulation 30 (LODR)-Newspaper Publication
07-Jul-2026 | Source : BSECopy of newspaper publication
Corporate Actions

No Upcoming Board Meetings

Avadh Sugar & Energy Ltd has declared 100% dividend, ex-date: 17 Jul 26

No Splits history available

Avadh Sugar & Energy Ltd has announced 1:1 bonus issue, ex-date: 27 Jun 19

No Rights history available
Quality key factors
Valuation key factors
Technicals key factors
 Technical Indicator Scale: Bearish, Mildly Bearish, Sideways, Mildly Bullish, Bullish Turned
 Shareholding Snapshot : Mar 2026
Shareholding Compare (%holding)
Promoters
None
Held by 4 Schemes (0.01%)
Held by 27 FIIs (1.76%)
New India Retailing And Investment Ltd (9.72%)
Anil Kumar Goel (5.53%)
27.08%
Quarterly Results Snapshot (Standalone) - Mar'26 - YoY

YoY Growth in quarter ended Mar 2026 is -1.20% vs 9.52% in Mar 2025
YoY Growth in quarter ended Mar 2026 is -22.42% vs 29.64% in Mar 2025
Half Yearly Results Snapshot (Standalone) - Sep'25

Growth in half year ended Sep 2025 is 3.34% vs -9.43% in Sep 2024
Growth in half year ended Sep 2025 is -257.56% vs -81.35% in Sep 2024
Nine Monthly Results Snapshot (Standalone) - Dec'25
YoY Growth in nine months ended Dec 2025 is 3.38% vs -5.64% in Dec 2024
YoY Growth in nine months ended Dec 2025 is -89.54% vs -77.67% in Dec 2024
Annual Results Snapshot (Standalone) - Mar'26
YoY Growth in year ended Mar 2026 is 2.20% vs -2.15% in Mar 2025
YoY Growth in year ended Mar 2026 is -34.83% vs -31.36% in Mar 2025
About Avadh Sugar & Energy Ltd

Company Coordinates


