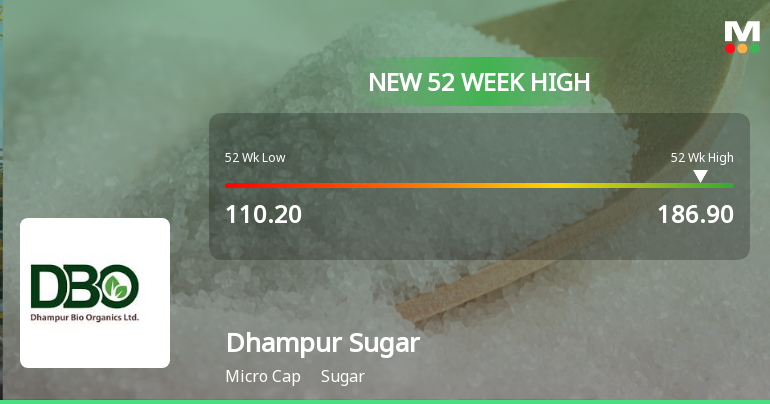
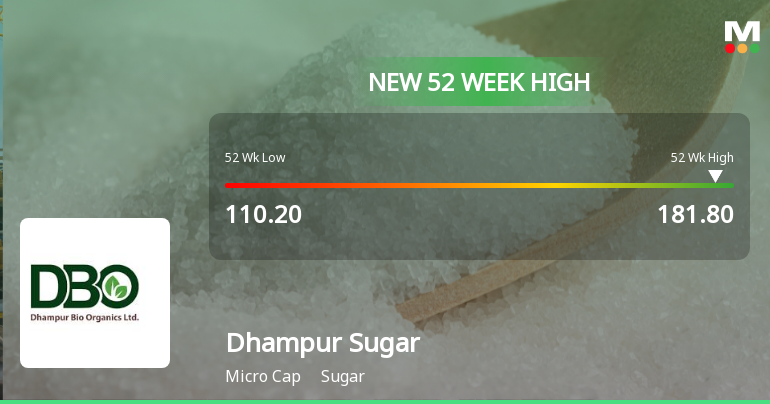
Dhampur Sugar

INR
168.65
-8 (-4.53%)
BSENSE

Sep 04, 11:42 AM

BSE+NSE Vol: 3.67 lacs

  • Price Points
  • Score
  • Mojo Parameters
  • Total Return
  • News and Corporate Actions
  • Key factors
  • Shareholding
  • Financials
  • CompanyCV
stock-summaryPrice Point
High/Low

1Day

52 Week

Valuation
Technical
Day's Volume

CASH

3.67 lacs (-25.02%) Volume

Shareholding (Jun 2026)

FII

1.95%

Held by 30 FIIs

DII

1.14%

Held by 1 DIIs

Promoter

49.87%

Why is Dhampur Sugar Mills Ltd falling/rising?

04-Sep-2026

As of 03-Sep, Dhampur Sugar Mills Ltd's stock price is rising to 176.65, up 3.58%. This increase is driven by a trend reversal after previous declines, strong sector performance, and positive market sentiment, despite a decrease in delivery volume.

As of 03-Sep, Dhampur Sugar Mills Ltd's stock price is rising, currently at 176.65, reflecting a change of 6.1 (3.58%) upward. This increase can be attributed to several factors. Firstly, the stock has outperformed the sector by 1.56% today, indicating strong relative performance. Additionally, after two consecutive days of decline, the stock has experienced a trend reversal, gaining momentum today. It opened with a gap up of 2.05%, which suggests positive market sentiment at the start of trading.<BR><BR>Moreover, the stock reached an intraday high of Rs 178.5, marking a 4.66% increase during the day. The current price is also higher than the 20-day, 50-day, 100-day, and 200-day moving averages, which typically signals a bullish trend. However, it is worth noting that the stock's delivery volume has decreased by 39.27% compared to the 5-day average, indicating a decline in investor participation. Despite this, the stock remains liquid enough for trading, as it meets the liquidity criteria based on the average traded value.<BR><BR>Overall, the combination of a positive opening, trend reversal, and strong performance relative to the sector contributes to the rising stock price of Dhampur Sugar Mills Ltd.

View full answer

Who are in the management team of Dhampur Sugar?

01-Sep-2026

The management team of Dhampur Sugar includes A K Goel (Chairman & Executive Director), Gaurav Goel (Managing Director), Anant Pande (Whole Time Director & CEO), and Aparna Goel (Company Secretary). The board also features independent and non-executive directors, including M P Mehrotra, Anuj Khanna, Yashwardhan Poddar, Satpal Kumar Arora, and Pallavi Khandelwal.

The management team of Dhampur Sugar includes the following key members:<BR><BR>1. **A K Goel** - Chairman & Executive Director<BR>2. **Gaurav Goel** - Managing Director<BR>3. **Anant Pande** - Whole Time Director & CEO<BR>4. **Aparna Goel** - Company Secretary & Compliance Officer<BR><BR>Additionally, the board features several independent and non-executive directors:<BR><BR>- **M P Mehrotra** - Non-Executive & Independent Director<BR>- **Anuj Khanna** - Independent Director<BR>- **Yashwardhan Poddar** - Non-Executive & Independent Director<BR>- **Satpal Kumar Arora** - Non-Executive & Non-Independent Director<BR>- **Pallavi Khandelwal** - Independent Director<BR><BR>These individuals play significant roles in guiding the company's strategic direction and governance.

View full answer

What does Dhampur Sugar do?

01-Sep-2026

Dhampur Sugar Mills Ltd manufactures and sells sugar and related products, with a market cap of INR 1,123 Cr. As of June 2026, it reported net sales of 553 Cr and a net profit of 6 Cr.

Overview:<BR>Dhampur Sugar Mills Ltd is engaged in the manufacturing and selling of sugar and related products, operating within the sugar industry and classified as a micro-cap company.<BR><BR>History:<BR>Incorporated in May 1933, Dhampur Sugar Mills Ltd has been operational for several decades. The latest quarterly results reported net sales and net profit for June 2026.<BR><BR>Financial Snapshot:<BR>Net Sales: 553 Cr (Quarterly Results - Jun 2026) <BR>Net Profit: 6 Cr (Quarterly Results - Jun 2026) <BR>Market Cap: INR 1,123 Cr (Micro Cap)<BR><BR>Key Metrics:<BR>P/E: 16.00 <BR>Industry P/E: 23 <BR>Dividend Yield: 1.14% <BR>Debt-Equity: 0.52 <BR>Return on Equity: 5.44% <BR>Price to Book: 0.94 <BR><BR>Contact Details:<BR>Address: Sugar Mills Compound, Dhampur Bijnor Uttar Pradesh : 246761 <BR>Tel: 01344-220006 <BR>Email: investordesk@dhampur.com <BR>Website: http://www.dhampur.com

View full answer

Who are the peers of the Dhampur Sugar?

01-Sep-2026

Dhampur Sugar's peers include Sh.Renuka Sugar, Bannari Amm.Sug., Dalmia Bharat, Avadh Sugar, and others. Avadh Sugar leads in 1-year returns at 108.16%, while Dhampur Sugar has a return of 45.08%, and Sh.Renuka Sugar shows the lowest return at -12.17%.

Peers: The peers of Dhampur Sugar are Sh.Renuka Sugar, Bannari Amm.Sug., Dalmia Bharat, Avadh Sugar, Uttam Sug.Mills, Dwarikesh Sugar, Dhampur Bio, Zuari Industries, Magadh Sugar, and M.V.K. Agro.<BR><BR>Quality Snapshot: Below Average management risk is observed at Sh.Renuka Sugar and Zuari Industries, while Average management risk is found at Bannari Amm.Sug., Dalmia Bharat, Avadh Sugar, Uttam Sug.Mills, Dhampur Sugar, Dwarikesh Sugar, Dhampur Bio, Magadh Sugar, and M.V.K. Agro. Below Average growth is noted at Sh.Renuka Sugar, Bannari Amm.Sug., Dalmia Bharat, Avadh Sugar, Uttam Sug.Mills, Dhampur Sugar, Dhampur Bio, Zuari Industries, and Magadh Sugar, while Average growth is seen at Dwarikesh Sugar. Good capital structure is present at Bannari Amm.Sug. and Dalmia Bharat, while Average capital structure is found at Dwarikesh Sugar and the rest have Below Average capital structure.<BR><BR>Return Snapshot: Avadh Sugar has the highest 1-year return at 108.16%, while Sh.Renuka Sugar has the lowest at -12.17%. Dhampur Sugar's 1-year return of 45.08% is significantly higher than Sh.Renuka Sugar's but lower than Avadh Sugar's. Additionally, Zuari Industries is the only peer with a negative six-month return.

View full answer

How big is Dhampur Sugar?

01-Sep-2026

As of 31st August, Dhampur Sugar Mills Ltd has a market capitalization of 1,123.00 Cr, with recent Net Sales of 1,998.64 Cr and a Net Profit of 70.28 Cr.

As of 31st August, Dhampur Sugar Mills Ltd has a market capitalization of 1,123.00 Cr, categorizing it as a Micro Cap company.<BR><BR>In the latest four quarters, the company reported Net Sales of 1,998.64 Cr and a Net Profit of 70.28 Cr.<BR><BR>The latest annual period for the balance sheet is March 2026, with Shareholder's Funds amounting to 1,197.36 Cr and Total Assets of 2,415.31 Cr.

View full answer

Should I buy, sell or hold Dhampur Sugar Mills Ltd?

01-Aug-2026

Are Dhampur Sugar Mills Ltd latest results good or bad?

30-May-2026

Dhampur Sugar Mills Ltd's latest results show strong sequential growth in Q4 FY26, with a 72.29% increase in net profit and an 8.75% rise in net sales. However, year-on-year comparisons reveal declines in both net profit and sales, indicating ongoing challenges that investors should consider.

The latest results for Dhampur Sugar Mills Ltd present a mixed picture. In Q4 FY26, the company reported a net profit of ₹45.64 crore, which is a significant increase of 72.29% compared to the previous quarter. This indicates strong sequential growth and operational leverage during the peak sugar crushing season. Additionally, net sales rose by 8.75% quarter-on-quarter to ₹490.65 crore, which is a positive sign.<BR><BR>However, when looking at the year-on-year performance, there are notable declines. Net profit decreased by 6.88% compared to the same quarter last year, and net sales fell by 20.75% year-on-year. This suggests that while the company has shown improvement in the short term, it is still facing challenges in the broader context of its annual performance.<BR><BR>Furthermore, the full-year results for FY2025 reveal deeper concerns, with net sales declining by 9.8% and net profit plummeting by 61.19% compared to FY2024. The operating margins also contracted, indicating ongoing structural issues within the business.<BR><BR>In summary, while the Q4 results show encouraging short-term recovery, the overall performance reflects significant challenges that the company needs to address for sustainable growth. Investors should be cautious and consider both the positive quarterly trends and the concerning long-term trajectory.

View full answer

When is the next results date for Dhampur Sugar Mills Ltd?

22-May-2026

The next results date for Dhampur Sugar Mills Ltd is 28 May 2026.

The next results date for Dhampur Sugar Mills Ltd is scheduled for 28 May 2026.

View full answer

Has Dhampur Sugar Mills Ltd declared dividend?

22-May-2026

Yes, Dhampur Sugar Mills Ltd has declared a 20% dividend, with an ex-date of 26 May 2026. However, total returns over various periods show significant price declines, indicating challenges in maintaining shareholder value despite the dividend.

Dhampur Sugar Mills Ltd has declared a 20% dividend.<BR><BR>Dividend Details:<BR>- Percentage announced: 20%<BR>- Ex-date: 26 May 2026<BR><BR>Dividend Yield: 0%<BR><BR>Total Returns by Period:<BR>In the 3 months period, the price return was 28.78%, the dividend return was 1.73%, resulting in a total return of 30.51%.<BR><BR>In the 6 months period, the price return was 13.08%, the dividend return was 1.56%, leading to a total return of 14.64%.<BR><BR>For the 1 year period, the price return was -0.65%, the dividend return was 1.40%, culminating in a total return of 0.75%.<BR><BR>Over the 2 years period, the price return was -34.59%, the dividend return was 0.91%, resulting in a total return of -33.68%.<BR><BR>In the 3 years period, the price return was -40.45%, the dividend return was 0.75%, leading to a total return of -39.7%.<BR><BR>During the 4 years period, the price return was -48.72%, the dividend return was 1.21%, culminating in a total return of -47.51%.<BR><BR>For the 5 years period, the price return was -54.82%, the dividend return was 2.74%, resulting in a total return of -52.08%.<BR><BR>Overall, while Dhampur Sugar Mills Ltd has declared a dividend, the total returns over various periods indicate significant price declines, particularly over the longer term, suggesting challenges in maintaining shareholder value despite the dividend payouts.

View full answer

Is Dhampur Sugar technically bullish or bearish?

25-Nov-2025

As of November 24, 2025, the market trend is mildly bearish, indicated by bearish signals from the MACD, moving averages, and Bollinger Bands, despite some mixed signals suggesting limited upside potential.

As of 24 November 2025, the technical trend has changed from bearish to mildly bearish. The current stance is mildly bearish, driven by the weekly MACD indicating bearish momentum and the daily moving averages also showing a bearish signal. The Bollinger Bands are bearish on both weekly and monthly time frames, while the KST is mildly bullish weekly but bearish monthly. The Dow Theory shows no trend on the weekly chart but is mildly bullish on the monthly chart. Overall, the mixed signals suggest a weak bearish sentiment with limited upside potential in the near term.

View full answer

How has been the historical performance of Dhampur Sugar?

13-Nov-2025

Dhampur Sugar's historical performance shows a decline in net sales, operating profit, and net profit from March 2023 to March 2025, indicating challenges in revenue and profitability. However, cash flow from operating activities improved significantly in the same period.

Answer:<BR>The historical performance of Dhampur Sugar shows a fluctuating trend in its financial metrics over the years.<BR><BR>Breakdown:<BR>Dhampur Sugar's net sales have seen a decline from INR 2,459.76 crore in March 2023 to INR 1,956.52 crore in March 2025, reflecting a downward trend. The total operating income followed a similar pattern, decreasing from INR 2,459.76 crore in March 2023 to INR 1,956.52 crore in March 2025. The company's total expenditure, excluding depreciation, also decreased from INR 2,156.43 crore in March 2023 to INR 1,786.98 crore in March 2025. Operating profit (PBDIT) has declined from INR 318.81 crore in March 2023 to INR 187.31 crore in March 2025, indicating reduced profitability. Profit before tax dropped from INR 222.79 crore in March 2023 to INR 75.11 crore in March 2025, while profit after tax decreased from INR 157.99 crore to INR 52.42 crore in the same period. The consolidated net profit also fell from INR 157.50 crore in March 2023 to INR 52.21 crore in March 2025. On the balance sheet, total liabilities increased slightly from INR 2,356.76 crore in March 2024 to INR 2,387.01 crore in March 2025, while total assets rose from INR 2,356.76 crore to INR 2,387.01 crore. Cash flow from operating activities showed a recovery to INR 200 crore in March 2025 from a negative INR 52 crore in March 2024, indicating improved cash generation. Overall, the financial performance of Dhampur Sugar reflects challenges in revenue and profit generation, alongside a modest recovery in cash flow.

View full answer

Is Dhampur Sugar overvalued or undervalued?

27-Oct-2025

As of October 24, 2025, Dhampur Sugar is considered very attractive and undervalued with a PE ratio of 17.24, an EV to EBITDA of 10.14, and a Price to Book Value of 0.77, making it a compelling investment opportunity compared to its peers, despite a year-to-date return of -14.52%.

As of 24 October 2025, the valuation grade for Dhampur Sugar has moved from attractive to very attractive, indicating a significant improvement in its perceived value. The company is currently considered undervalued, with a PE ratio of 17.24, an EV to EBITDA of 10.14, and a Price to Book Value of 0.77. These ratios suggest that the stock is trading at a discount compared to its earnings and asset value.<BR><BR>In comparison to its peers, Dhampur Sugar's valuation stands out; for instance, EID Parry is deemed very expensive with a PE ratio of 23.79, while Balrampur Chini is rated fair with a PE of 22.38. This positions Dhampur Sugar favorably within the industry, especially given its lower EV to Sales ratio of 0.85 compared to the higher ratios of its peers. Despite recent underperformance against the Sensex, with a year-to-date return of -14.52% versus the Sensex's 7.77%, the current valuation metrics indicate that Dhampur Sugar presents a compelling investment opportunity.

View full answer

Who are the top shareholders of the Dhampur Sugar?

06-Jun-2025

The top shareholders of Dhampur Sugar include Goel Investments Limited with 27.58%, individual investors with 40.67%, and 29 Foreign Institutional Investors holding 1.97%. The highest public shareholder is Biz Secure Labs Private Limited, owning 1.38%.

The top shareholders of Dhampur Sugar primarily consist of promoters, with Goel Investments Limited holding the highest stake at 27.58%. Individual investors collectively own 40.67% of the shares. Additionally, there are 29 Foreign Institutional Investors (FIIs) holding about 1.97% of the company, while mutual funds have a negligible presence with 0.0% held by six schemes. The highest public shareholder is Biz Secure Labs Private Limited, which owns 1.38% of the shares.

View full answer
iScoreScore
Click here to find our call on this stock
Strong Sell
Sell
Hold
Buy
Strong Buy

Dashboard

1

Weak Long Term Fundamental Strength with a -17.16% CAGR growth in Operating Profits over the last 5 years

  • Low ability to service debt as the company has a high Debt to EBITDA ratio of 5.19 times
  • INTEREST(Latest six months) At Rs 29.99 cr has Grown at 59.35%
  • PBT LESS OI(Q) At Rs 2.40 cr has Fallen at -84.6% (vs previous 4Q average)
  • PAT(Q) At Rs 6.03 cr has Fallen at -62.9% (vs previous 4Q average)
2

Despite the size of the company, domestic mutual funds hold only 0% of the company

stock-summaryMojo Parameters

Mojo Parameters

Loading Valuation Snapshot...

Stock DNA

stock-summary
Industry

Sugar

stock-summary
Market cap

INR 1,085 Cr (Micro Cap)

stock-summary
P/E

16.00

stock-summary
Industry P/E

23

stock-summary
Dividend Yield

1.13%

stock-summary
Debt Equity

0.52

stock-summary
Return on Equity

5.44%

stock-summary
Price to Book

0.95

Revenue and Profits:
Net Sales:
553 Cr
(Quarterly Results - Jun 2026)
Net Profit:
6 Cr
stock-summaryTotal Returns
Total Returns (Price + Dividend) stock-summary
Dividend Yield (1.13%)
TimePeriod
Price Return
Dividend Return
Total Return
3 Months
21.07%
0%
21.07%
6 Months
30.84%
1.58%
32.42%
1 Year
22.88%
1.49%
24.37%
2 Years
-25.64%
0.91%
-24.73%
3 Years
-37.98%
0.65%
-37.33%
4 Years
-27.34%
1.39%
-25.95%
5 Years
1.65%
3.97%
5.62%

Latest dividend: 2 per share ex-dividend date: May-26-2026

Risk Adjusted Returns v/s stock-summary
Returns Beta
Icon
Beta has not been calculated since enough price history is not available
stock-summaryNews & Corporate Actions

Announcements stock-summary

Shareholder Meeting / Postal Ballot-Scrutinizers Report

27-Aug-2026 | Source : BSE

Please find attached Voting Results alongwith consolidated Scrutinizer Report for 91st Annual General Meeting of the Company Scheduled on 26th August 2026.

Shareholder Meeting / Postal Ballot-Outcome of AGM

26-Aug-2026 | Source : BSE

Please find attached proceedings of 91st Annual General Meeting of the Company.

Announcement under Regulation 30 (LODR)-Credit Rating

03-Aug-2026 | Source : BSE

Please find attached disclosure related to Credit Rating assigned to the Company.

Corporate Actions stock-summary

stock-summary
BOARD MEETING

No Upcoming Board Meetings

stock-summary
DIVIDEND

Dhampur Sugar Mills Ltd has declared 20% dividend, ex-date: 26 May 26

stock-summary
SPLITS

No Splits history available

stock-summary
BONUS

No Bonus history available

stock-summary
RIGHTS

No Rights history available

stock-summaryKey Factors

Quality key factors stock-summary

Factor
Value
Sales Growth (5y)
-10.41%
EBIT Growth (5y)
-17.16%
EBIT to Interest (avg)
3.85
Debt to EBITDA (avg)
2.90
Net Debt to Equity (avg)
0.52
Sales to Capital Employed (avg)
1.31
Tax Ratio
23.99%
Dividend Payout Ratio
0
Pledged Shares
0
Institutional Holding
3.08%
ROCE (avg)
12.17%
ROE (avg)
11.40%

Valuation key factors

Factor
Value
P/E Ratio
16
Industry P/E
23
Price to Book Value
0.95
EV to EBIT
14.60
EV to EBITDA
9.67
EV to Capital Employed
0.97
EV to Sales
0.88
PEG Ratio
0.42
Dividend Yield
1.13%
ROCE (Latest)
6.11%
ROE (Latest)
5.44%

Technicals key factors

Indicator
Weekly
Monthly
MACD
Bullish
Mildly Bullish
RSI
No Signal
No Signal
Bollinger Bands
Bullish
Mildly Bullish
Moving Averages
Bullish (Daily)
KST
Bullish
Mildly Bullish
Dow Theory
Mildly Bullish
No Trend
OBV
Mildly Bearish
No Trend
stock-summary Technical Indicator Scale: Bearish, Mildly Bearish, Sideways, Mildly Bullish, Bullish  Turned 
stock-summaryShareholding
Shareholding Snapshot : Jun 2026stock-summary
Shareholding Compare (%holding) stock-summary
Majority shareholders

Promoters

Pledged Promoter Holdings

None

Mutual Funds

Held by 5 Schemes (0.0%)

FIIs

Held by 30 FIIs (1.95%)

Promoter with highest holding

Goel Investments Ltd (28.0%)

Highest Public shareholder

Anil L Shah (1%)

Individual Investors Holdings

40.25%

stock-summaryFinancial
[
  {
    "link": "quarterly",
    "btn_text": "All Quarterly Results",
    "header": "Quarterly Results Snapshot (Consolidated) - Jun'26 - QoQ",
    "rhs": [
      {
        "prefix": "Net Sales ",
        "suffix": "QoQ Growth in quarter ended Jun 2026 is 12.63% vs 8.75% in Mar 2026",
        "dir": 1
      },
      {
        "prefix": "Consolidated Net Profit ",
        "suffix": "QoQ Growth in quarter ended Jun 2026 is -86.79% vs 72.29% in Mar 2026",
        "dir": -1
      }
    ],
    "table": {
      "header": [
        "Jun'26",
        "Mar'26",
        "Change(%)"
      ],
      "body": [
        {
          "field": "Net Sales",
          "val1": "552.62",
          "val2": "490.65",
          "chgp": "12.63%",
          "chgp_class": "positive"
        },
        {
          "field": "Operating Profit (PBDIT) excl Other Income",
          "val1": "31.28",
          "val2": "85.02",
          "chgp": "-63.21%",
          "chgp_class": "negative"
        },
        {
          "field": "Interest",
          "val1": "15.82",
          "val2": "14.17",
          "chgp": "11.64%",
          "chgp_class": "negative"
        },
        {
          "field": "Exceptional Items",
          "val1": "0.00",
          "val2": "0.00",
          "chgp": "",
          "chgp_class": "neutral"
        },
        {
          "field": "Consolidate Net Profit",
          "val1": "6.03",
          "val2": "45.64",
          "chgp": "-86.79%",
          "chgp_class": "negative"
        },
        {
          "field": "Operating Profit Margin (Excl OI)",
          "val1": "5.66%",
          "val2": "17.33%",
          "chgp": "-11.67%",
          "chgp_class": "negative"
        }
      ]
    }
  },
  {
    "link": "half-yearly",
    "btn_text": "All Half Yearly Results",
    "header": "Half Yearly Results Snapshot (Consolidated) - Sep'25",
    "rhs": [
      {
        "prefix": "Net Sales ",
        "suffix": " Growth in half year ended Sep 2025 is 10.82% vs -25.52% in Sep 2024",
        "dir": 1
      },
      {
        "prefix": "Consolidated Net Profit ",
        "suffix": " Growth in half year ended Sep 2025 is 41.02% vs -123.50% in Sep 2024",
        "dir": 1
      }
    ],
    "table": {
      "header": [
        "Sep'25",
        "Sep'24",
        "Change(%)"
      ],
      "body": [
        {
          "field": "Net Sales",
          "val1": "1,025.61",
          "val2": "925.48",
          "chgp": "10.82%",
          "chgp_class": "positive"
        },
        {
          "field": "Operating Profit (PBDIT) excl Other Income",
          "val1": "32.33",
          "val2": "26.81",
          "chgp": "20.59%",
          "chgp_class": "positive"
        },
        {
          "field": "Interest",
          "val1": "26.16",
          "val2": "28.20",
          "chgp": "-7.23%",
          "chgp_class": "positive"
        },
        {
          "field": "Exceptional Items",
          "val1": "0.00",
          "val2": "0.00",
          "chgp": "",
          "chgp_class": "neutral"
        },
        {
          "field": "Consolidate Net Profit",
          "val1": "-7.03",
          "val2": "-11.92",
          "chgp": "41.02%",
          "chgp_class": "positive"
        },
        {
          "field": "Operating Profit Margin (Excl OI)",
          "val1": "3.15%",
          "val2": "2.90%",
          "chgp": "0.25%",
          "chgp_class": "positive"
        }
      ]
    }
  },
  {
    "link": "nine-monthly",
    "btn_text": "All Nine Monthly Results",
    "header": "Nine Monthly Results Snapshot (Consolidated) - Dec'25",
    "rhs": [
      {
        "prefix": "Net Sales ",
        "suffix": "YoY Growth in nine months ended Dec 2025 is 10.42% vs -16.79% in Dec 2024",
        "dir": 1
      },
      {
        "prefix": "Consolidated Net Profit ",
        "suffix": "YoY Growth in nine months ended Dec 2025 is 508.12% vs -96.12% in Dec 2024",
        "dir": 1
      }
    ],
    "table": {
      "header": [
        "Dec'25",
        "Dec'24",
        "Change(%)"
      ],
      "body": [
        {
          "field": "Net Sales",
          "val1": "1,476.79",
          "val2": "1,337.37",
          "chgp": "10.42%",
          "chgp_class": "positive"
        },
        {
          "field": "Operating Profit (PBDIT) excl Other Income",
          "val1": "88.27",
          "val2": "68.45",
          "chgp": "28.96%",
          "chgp_class": "positive"
        },
        {
          "field": "Interest",
          "val1": "34.59",
          "val2": "38.34",
          "chgp": "-9.78%",
          "chgp_class": "positive"
        },
        {
          "field": "Exceptional Items",
          "val1": "0.00",
          "val2": "0.00",
          "chgp": "",
          "chgp_class": "neutral"
        },
        {
          "field": "Consolidate Net Profit",
          "val1": "19.46",
          "val2": "3.20",
          "chgp": "508.12%",
          "chgp_class": "positive"
        },
        {
          "field": "Operating Profit Margin (Excl OI)",
          "val1": "5.98%",
          "val2": "5.12%",
          "chgp": "0.86%",
          "chgp_class": "positive"
        }
      ]
    }
  },
  {
    "link": "annual",
    "btn_text": "All Annual Results",
    "header": "Annual Results Snapshot (Consolidated) - Mar'26",
    "rhs": [
      {
        "prefix": "Net Sales ",
        "suffix": "YoY Growth in year ended Mar 2026 is 0.56% vs -9.79% in Mar 2025",
        "dir": 1
      },
      {
        "prefix": "Consolidated Net Profit ",
        "suffix": "YoY Growth in year ended Mar 2026 is 24.69% vs -61.13% in Mar 2025",
        "dir": 1
      }
    ],
    "table": {
      "header": [
        "Mar'26",
        "Mar'25",
        "Change(%)"
      ],
      "body": [
        {
          "field": "Net Sales",
          "val1": "1,967.44",
          "val2": "1,956.52",
          "chgp": "0.56%",
          "chgp_class": "positive"
        },
        {
          "field": "Operating Profit (PBDIT) excl Other Income",
          "val1": "173.28",
          "val2": "169.54",
          "chgp": "2.21%",
          "chgp_class": "positive"
        },
        {
          "field": "Interest",
          "val1": "48.75",
          "val2": "50.28",
          "chgp": "-3.04%",
          "chgp_class": "positive"
        },
        {
          "field": "Exceptional Items",
          "val1": "0.00",
          "val2": "0.00",
          "chgp": "",
          "chgp_class": "neutral"
        },
        {
          "field": "Consolidate Net Profit",
          "val1": "65.10",
          "val2": "52.21",
          "chgp": "24.69%",
          "chgp_class": "positive"
        },
        {
          "field": "Operating Profit Margin (Excl OI)",
          "val1": "8.81%",
          "val2": "8.67%",
          "chgp": "0.14%",
          "chgp_class": "positive"
        }
      ]
    }
  }
]

Quarterly Results Snapshot (Consolidated) - Jun'26 - QoQstock-summary

Jun'26
Mar'26
Change(%)
Net Sales
552.62
490.65
12.63%
Operating Profit (PBDIT) excl Other Income
31.28
85.02
-63.21%
Interest
15.82
14.17
11.64%
Exceptional Items
0.00
0.00
Consolidate Net Profit
6.03
45.64
-86.79%
Operating Profit Margin (Excl OI)
5.66%
17.33%
-11.67%
Values in Rs Cr.
Direction Arrows
Net Sales

QoQ Growth in quarter ended Jun 2026 is 12.63% vs 8.75% in Mar 2026

Direction Arrows
Consolidated Net Profit

QoQ Growth in quarter ended Jun 2026 is -86.79% vs 72.29% in Mar 2026

Half Yearly Results Snapshot (Consolidated) - Sep'25stock-summary

Sep'25
Sep'24
Change(%)
Net Sales
1,025.61
925.48
10.82%
Operating Profit (PBDIT) excl Other Income
32.33
26.81
20.59%
Interest
26.16
28.20
-7.23%
Exceptional Items
0.00
0.00
Consolidate Net Profit
-7.03
-11.92
41.02%
Operating Profit Margin (Excl OI)
3.15%
2.90%
0.25%
Values in Rs Cr.
Direction Arrows
Net Sales

Growth in half year ended Sep 2025 is 10.82% vs -25.52% in Sep 2024

Direction Arrows
Consolidated Net Profit

Growth in half year ended Sep 2025 is 41.02% vs -123.50% in Sep 2024

Nine Monthly Results Snapshot (Consolidated) - Dec'25stock-summary

Dec'25
Dec'24
Change(%)
Net Sales
1,476.79
1,337.37
10.42%
Operating Profit (PBDIT) excl Other Income
88.27
68.45
28.96%
Interest
34.59
38.34
-9.78%
Exceptional Items
0.00
0.00
Consolidate Net Profit
19.46
3.20
508.12%
Operating Profit Margin (Excl OI)
5.98%
5.12%
0.86%
Values in Rs Cr.
Direction Arrows
Net Sales

YoY Growth in nine months ended Dec 2025 is 10.42% vs -16.79% in Dec 2024

Direction Arrows
Consolidated Net Profit

YoY Growth in nine months ended Dec 2025 is 508.12% vs -96.12% in Dec 2024

Annual Results Snapshot (Consolidated) - Mar'26stock-summary

Mar'26
Mar'25
Change(%)
Net Sales
1,967.44
1,956.52
0.56%
Operating Profit (PBDIT) excl Other Income
173.28
169.54
2.21%
Interest
48.75
50.28
-3.04%
Exceptional Items
0.00
0.00
Consolidate Net Profit
65.10
52.21
24.69%
Operating Profit Margin (Excl OI)
8.81%
8.67%
0.14%
Values in Rs Cr.
Direction Arrows
Net Sales

YoY Growth in year ended Mar 2026 is 0.56% vs -9.79% in Mar 2025

Direction Arrows
Consolidated Net Profit

YoY Growth in year ended Mar 2026 is 24.69% vs -61.13% in Mar 2025

stock-summaryCompany CV
About Dhampur Sugar Mills Ltd stock-summary
stock-summary
Dhampur Sugar Mills Ltd
Micro Cap
Sugar
Incorporated in May '33, The Dhampur Sugar Mills Limited (DSML) was promoted by the Goel family of Bareilly, Uttar Pradesh. The Company is engaged mainly in the manufacturing and selling of sugar, chemicals/ethyl, ethanol, potable spirits, co-generation and sale of power. DSML has a sugar unit at Dhampur (12 lac tca of cane), a sugar unit at Mansurpur (5 lac tca of cane), a paper unit at Sikandrabad (50 tpd), a unit of DSM Chemicals at Dhampur and a straw board unit.
Company Coordinates stock-summary
Company Details
Sugar Mills Compound, Dhampur Bijnor Uttar Pradesh : 246761
stock-summary
Tel: 01344-220006
stock-summary
investordesk@dhampur.com
Registrar Details
Alankit Assignments Ltd , Alankit House , 2 E/21, Jhandewala Extension, New Delhi