
Compare Dhampur.Spl.Sug. with Similar Stocks
Dashboard
Poor Management Efficiency with a low ROE of 6.92%
- The company has been able to generate a Return on Equity (avg) of 6.92% signifying low profitability per unit of shareholders funds
The company is Net-Debt Free
Healthy long term growth as Net Sales has grown by an annual rate of 30.28% and Operating profit at 51.50%
The company has declared Positive results for the last 7 consecutive quarters
With ROE of 13.4, it has a Fair valuation with a 2.4 Price to Book Value
Majority shareholders : Promoters
Consistent Returns over the last 3 years
Total Returns (Price + Dividend) 
Latest dividend: 0.8000 per share ex-dividend date: Sep-23-2014
Risk Adjusted Returns v/s
Returns Beta

News

Dhampure Speciality Sugars Ltd Valuation Shifts Signal Changing Market Perception
Dhampure Speciality Sugars Ltd has witnessed a notable shift in its valuation parameters, moving from an attractive to a fair valuation grade as of early February 2026. Despite this adjustment, the company continues to deliver robust returns, outperforming the Sensex significantly over multiple time horizons. This article analyses the recent changes in key valuation metrics such as the price-to-earnings (P/E) and price-to-book value (P/BV) ratios, comparing them with historical averages and peer benchmarks to assess the stock’s price attractiveness.
Read full news article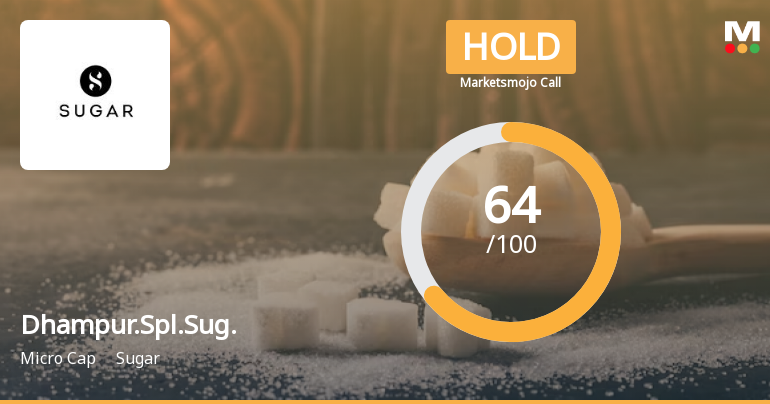
Dhampure Speciality Sugars Ltd is Rated Hold
Dhampure Speciality Sugars Ltd is rated 'Hold' by MarketsMOJO, with this rating last updated on 02 Feb 2026. However, all fundamentals, returns, and financial metrics discussed here reflect the company’s current position as of 02 June 2026, providing investors with an up-to-date analysis of the stock’s performance and outlook.
Read full news article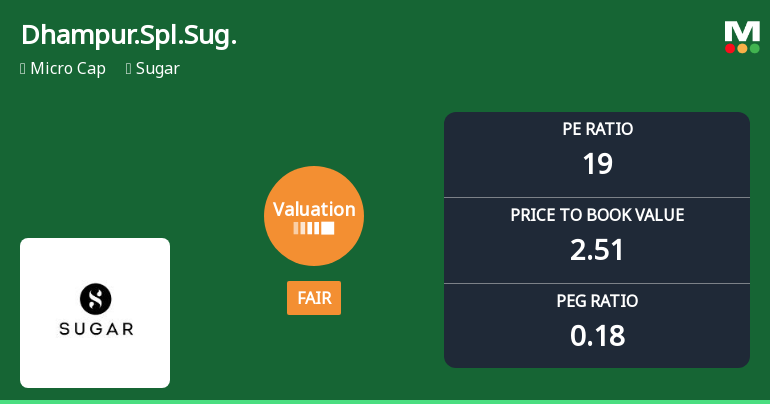
Dhampure Speciality Sugars Ltd: Valuation Shift Enhances Price Attractiveness Amid Strong Returns
Dhampure Speciality Sugars Ltd has witnessed a notable shift in its valuation parameters, moving from an expensive to a fair valuation grade as of early February 2026. This recalibration, reflected in key metrics such as the price-to-earnings (P/E) and price-to-book value (P/BV) ratios, invites a closer examination of the company’s price attractiveness relative to its historical averages and industry peers within the sugar sector.
Read full news article Announcements
Compliances-Reg.24(A)-Annual Secretarial Compliance
30-May-2026 | Source : BSEAnnual Secretarial Compliance Report of the Company for the year ended 31st March 2026
Announcement under Regulation 30 (LODR)-Newspaper Publication
30-May-2026 | Source : BSEPlease find attached herewith the newspaper publication of Audited Financial Statements for the quarter and financial year ended 31st March 2026 as per Regulation 47 of the SEBI (Listing Obligations and Disclosure Requirements) Regulations 2015 for your kind consideration and reference.
Announcement under Regulation 30 (LODR)-Change in Management
28-May-2026 | Source : BSEAppointment of Internal Auditor of the Company for FY 2026-27
Corporate Actions

No Upcoming Board Meetings

Dhampure Speciality Sugars Ltd has declared 8% dividend, ex-date: 23 Sep 14

No Splits history available

No Bonus history available

No Rights history available
Quality key factors
Valuation key factors
Technicals key factors
 Technical Indicator Scale: Bearish, Mildly Bearish, Sideways, Mildly Bullish, Bullish Turned
 Shareholding Snapshot : Mar 2026
Shareholding Compare (%holding)
Promoters
None
Held by 0 Schemes
Held by 0 FIIs
Sorabh Gupta (42.51%)
Sangeetha S (2.01%)
35.94%
Quarterly Results Snapshot (Consolidated) - Mar'26 - QoQ

QoQ Growth in quarter ended Mar 2026 is 5.87% vs 10.77% in Dec 2025
QoQ Growth in quarter ended Mar 2026 is -71.08% vs 4.62% in Dec 2025
Half Yearly Results Snapshot (Consolidated) - Sep'25

Growth in half year ended Sep 2025 is 60.27% vs 26.68% in Sep 2024
Growth in half year ended Sep 2025 is 75.90% vs 41.88% in Sep 2024
Nine Monthly Results Snapshot (Consolidated) - Dec'25
YoY Growth in nine months ended Dec 2025 is 53.00% vs 29.58% in Dec 2024
YoY Growth in nine months ended Dec 2025 is 107.53% vs 39.77% in Dec 2024
Annual Results Snapshot (Consolidated) - Mar'26
YoY Growth in year ended Mar 2026 is 46.71% vs 36.16% in Mar 2025
YoY Growth in year ended Mar 2026 is 92.71% vs 209.68% in Mar 2025
About Dhampure Speciality Sugars Ltd

Company Coordinates


