Dhampur.Spl.Sug.

  • Market Cap: Micro Cap
  • Industry: Sugar
  • ISIN: INE956B01013
  • NSEID:
  • BSEID: 531923
INR
150.35
-5.1 (-3.28%)
BSENSE

Aug 25, 03:30 PM

BSE+NSE Vol: 15.37 k

  • Price Points
  • Score
  • Mojo Parameters
  • Total Return
  • News and Corporate Actions
  • Key factors
  • Shareholding
  • Financials
  • CompanyCV
stock-summaryPrice Point
High/Low

1Day

52 Week

Valuation
Technical
Day's Volume

CASH

15.37 k (-40.29%) Volume

Shareholding (Jun 2026)

FII

0.00%

Held by 0 FIIs

DII

0.00%

Held by 0 DIIs

Promoter

60.27%

Why is Dhampure Speciality Sugars Ltd falling/rising?

25-Aug-2026

As of 24-Aug, Dhampure Speciality Sugars Ltd's stock price has risen to 155.45, reflecting a 1.04% increase. This growth is driven by strong performance metrics, positive technical indicators, and heightened investor participation, significantly outperforming the benchmark Sensex over various time frames.

As of 24-Aug, Dhampure Speciality Sugars Ltd is experiencing a rise in its stock price, currently at 155.45, with an increase of 1.6 (1.04%). This upward movement can be attributed to several factors. <BR><BR>Firstly, the stock has shown impressive performance compared to the benchmark Sensex, with a 1-week return of +9.70% while the Sensex has fallen by -0.46%. Over the past month, the stock has surged by +32.13%, significantly outperforming the Sensex's +1.72%. Year-to-date, the stock has increased by +57.02%, contrasting with the Sensex's decline of -9.21%. This trend continues over a one-year period, where the stock has risen by +68.51% compared to the Sensex's -4.84%, and over three years, it has increased by +249.33% against the Sensex's +18.57%. Such strong relative performance indicates robust investor confidence in the company.<BR><BR>Additionally, today's performance shows that Dhampure Speciality Sugars Ltd has outperformed its sector by 1.07%. The stock is also trading above its 5-day, 20-day, 50-day, 100-day, and 200-day moving averages, which is a positive technical indicator suggesting sustained upward momentum. <BR><BR>Moreover, there has been a notable increase in investor participation, with delivery volume on 21 August rising by 171.95% compared to the 5-day average. This increase in trading activity indicates heightened interest and confidence among investors, further supporting the stock's rise. <BR><BR>Overall, the combination of strong performance metrics, positive technical indicators, and increased investor participation contributes to the rising stock price of Dhampure Speciality Sugars Ltd.

View full answer

Who are in the management team of Dhampur.Spl.Sug.?

14-Aug-2026

The management team of Dhampur.Spl.Sug. includes Sorabh Gupta (Chairman & Managing Director), Praveen Singh (Director), Mohd Arshad Suhail Siddiqui (Independent Director), Aneesh Jain (Company Secretary & Compliance Officer), and Ajay Goyal (Independent Director).

The management team of Dhampur.Spl.Sug. includes the following individuals:<BR><BR>1. **Sorabh Gupta** - Chairman & Managing Director<BR>2. **Praveen Singh** - Director<BR>3. **Mohd Arshad Suhail Siddiqui** - Independent Director<BR>4. **Aneesh Jain** - Company Secretary & Compliance Officer<BR>5. **Ajay Goyal** - Independent Director<BR><BR>If you have any more questions about the company or its operations, feel free to ask!

View full answer

What does Dhampur.Spl.Sug. do?

14-Aug-2026

Dhampure Specialty Sugars Ltd is a micro-cap manufacturer and exporter of sugar products, with a market cap of INR 131 Cr and reported net sales of 17 Cr and net profit of 2 Cr for June 2026. The company has been operational since 1992 and maintains a P/E ratio of 20.00.

Overview:<BR>Dhampure Specialty Sugars Ltd is a leading manufacturer and exporter of various sugar products, operating in the sugar industry within the micro-cap market segment.<BR><BR>History:<BR>Incorporated in 1992, Dhampure Specialty Sugars Ltd has established itself in the sugar manufacturing sector. The latest quarterly results reported are for June 2026, showcasing the company's ongoing operations.<BR><BR>Financial Snapshot:<BR>- Net Sales: 17 Cr (Quarterly Results - Jun 2026)<BR>- Net Profit: 2 Cr (Quarterly Results - Jun 2026)<BR>- Market Cap: INR 131 Cr (Micro Cap)<BR><BR>Key Metrics:<BR>- P/E: 20.00<BR>- Industry P/E: 20<BR>- Dividend Yield: 0.00%<BR>- Debt Equity: -0.17<BR>- Return on Equity: 13.38%<BR>- Price to Book: 3.11<BR><BR>Contact Details:<BR>Address: Village Pallawala, Tehsil Dhampur Bijnor Uttar Pradesh : 246761<BR>Email: investor@sugarindia.com<BR>Website: http://www.sugarindia.com

View full answer

Who are the peers of the Dhampur.Spl.Sug.?

14-Aug-2026

The peers of Dhampur.Spl.Sug. include KM Sugar Mills, Sakthi Sugars, Rana Sugars, Indian Sucrose, Vishwaraj Sugar, Rajshree Sugars, Parvati Sweetner, Piccadily Sugar, Kesar Enterprise, and Kothari Sugars. Dhampur.Spl.Sug. leads in 1-year returns at 57.11%, significantly outperforming its peers, while several peers show below-average growth and negative returns.

Peers: The peers of Dhampur.Spl.Sug. are KM Sugar Mills, Sakthi Sugars, Rana Sugars, Indian Sucrose, Vishwaraj Sugar, Rajshree Sugars, Parvati Sweetner, Piccadily Sugar, Kesar Enterprise, and Kothari Sugars.<BR><BR>Quality Snapshot: Below Average management risk is observed at KM Sugar Mills, Sakthi Sugars, Vishwaraj Sugar, Rajshree Sugars, Parvati Sweetner, Piccadily Sugar, and Kesar Enterprise, while Average management risk is found at Rana Sugars and Indian Sucrose, and Good capital structure is noted at Kothari Sugars. Excellent growth is seen at Dhampur.Spl.Sug., while Average growth is present at Sakthi Sugars and Average management risk is found at Indian Sucrose, with Below Average growth at KM Sugar Mills, Rana Sugars, Vishwaraj Sugar, Rajshree Sugars, Parvati Sweetner, Piccadily Sugar, and Kesar Enterprise.<BR><BR>Return Snapshot: The peer with the highest 1-year return is Dhampur.Spl.Sug. at 57.11%, while the peer with the lowest is Sakthi Sugars at -21.56%. Dhampur.Spl.Sug.'s return significantly outperforms all peers. Additionally, Vishwaraj Sugar, Parvati Sweetner, Piccadily Sugar, and Kesar Enterprise have negative six-month returns.

View full answer

How big is Dhampur.Spl.Sug.?

14-Aug-2026

As of 14th August, Dhampur Speciality Sugars Ltd has a market capitalization of 120.84 Cr, with recent net sales of 65.84 Cr and a net profit of 6.29 Cr.

As of 14th August, Dhampure Speciality Sugars Ltd has a market capitalization of 120.84 Cr and is classified as a Micro Cap company.<BR><BR>In the latest four quarters, the company reported Net Sales of 65.84 Cr and a Net Profit of 6.29 Cr.<BR><BR>The latest annual period for the balance sheet is March 2025, with Shareholder's Funds amounting to 34.13 Cr and Total Assets of 39.24 Cr.

View full answer

Are Dhampure Speciality Sugars Ltd latest results good or bad?

05-Aug-2026

Dhampure Speciality Sugars Ltd's latest Q1 FY27 results are strong, with a 76.29% year-on-year increase in net profit to ₹1.71 crores and a 74.72% revenue growth to ₹17.42 crores. However, concerns about margin volatility, with operating margins at 12.86%, suggest investors should watch for sustainability in profitability.

Dhampure Speciality Sugars Ltd's latest results for Q1 FY27 can be considered good overall, showcasing significant growth in both revenue and net profit. The company reported a net profit of ₹1.71 crores, which is a remarkable increase of 76.29% year-on-year and a substantial 189.83% increase compared to the previous quarter. Additionally, revenue grew by 74.72% year-on-year, reaching ₹17.42 crores, marking the highest quarterly revenue in the company's recent history.<BR><BR>However, while the growth figures are impressive, there are concerns regarding margin volatility. The operating margin for the quarter was 12.86%, which, although an improvement from 3.41% in the previous quarter, remains below the peak of 21.14% achieved in Q3 FY26. This inconsistency raises questions about the sustainability of earnings and operational stability.<BR><BR>In summary, while the results indicate strong growth and recovery, the ongoing margin volatility suggests that investors should monitor the company's ability to maintain consistent profitability moving forward.

View full answer

Should I buy, sell or hold Dhampure Speciality Sugars Ltd?

05-Aug-2026

When is the next results date for Dhampure Speciality Sugars Ltd?

22-May-2026

The next results date for Dhampure Speciality Sugars Ltd is 28 May 2026.

The next results date for Dhampure Speciality Sugars Ltd is scheduled for 28 May 2026.

View full answer

Is Dhampur.Spl.Sug. overvalued or undervalued?

20-Nov-2025

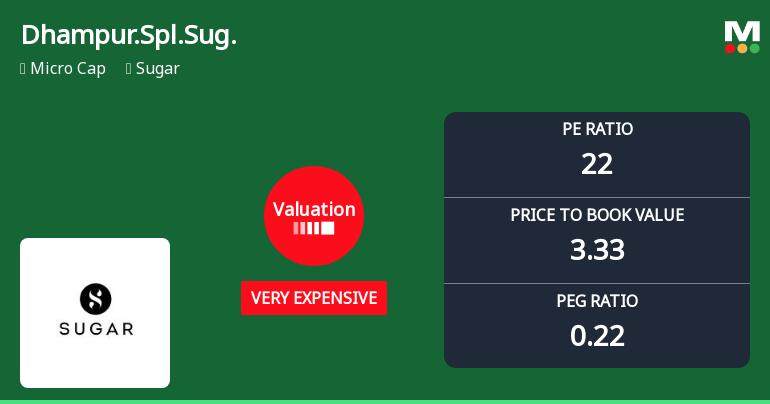
As of November 19, 2025, Dhampur.Spl.Sug. is considered overvalued with a valuation grade of expensive, a PE ratio of 22.23, and a strong historical return of 176.07%, compared to peers like EID Parry and Balrampur Chini, which are rated very expensive and fair, respectively.

As of 19 November 2025, the valuation grade for Dhampur.Spl.Sug. has moved from fair to expensive, indicating a shift in its market perception. The company is currently assessed as overvalued. Key ratios include a PE ratio of 22.23, an EV to EBITDA of 15.57, and a ROCE of 15.76%. <BR><BR>In comparison with peers, EID Parry is classified as very expensive with a PE of 20.46, while Balrampur Chini is rated as fair with a PE of 22.96. This suggests that Dhampur.Spl.Sug. is priced higher relative to some of its peers, despite its strong historical performance, as evidenced by a 3-year return of 176.07% compared to the Sensex's 38.15%.

View full answer

How has been the historical performance of Dhampur.Spl.Sug.?

17-Nov-2025

Dhampur.Spl.Sug. has shown significant growth from March 2020 to March 2025, with net sales increasing from 7.48 crore to 39.80 crore and a turnaround in profitability, achieving a profit after tax of 2.88 crore. The company also reported improved cash flow and a balanced financial position with total assets and liabilities at 39.24 crore.

Answer:<BR>The historical performance of Dhampur.Spl.Sug. shows a significant upward trend in net sales and profitability over the years, culminating in the latest figures for March 2025.<BR><BR>Breakdown:<BR>From March 2020 to March 2025, Dhampur.Spl.Sug. experienced a remarkable increase in net sales, rising from 7.48 crore to 39.80 crore. The total operating income followed a similar trajectory, reaching 39.80 crore in March 2025, up from 7.48 crore in March 2020. The raw material cost also increased, amounting to 25.10 crore in March 2025, but the operating profit (PBDIT) improved significantly, showing a profit of 3.88 crore in March 2025 compared to a loss of 0.17 crore in March 2023. Profit before tax reached 3.76 crore in March 2025, and profit after tax was reported at 2.88 crore, indicating a strong recovery and growth in profitability. The company's total assets increased to 39.24 crore in March 2025, while total liabilities stood at 39.24 crore, reflecting a balanced financial position. Cash flow from operating activities also showed improvement, with a positive cash flow of 8.00 crore in March 2025. Overall, the financial metrics indicate a robust performance and growth trajectory for Dhampur.Spl.Sug. over the past several years.

View full answer

Who are the top shareholders of the Dhampur.Spl.Sug.?

17-Jul-2025

The top shareholder of Dhampur.Spl.Sug. is Sorabh Gupta, holding 43.35%, with no pledged promoter holdings. The highest public shareholder is Sangeetha S at 2.15%, while individual investors own 37.27% of the company.

The top shareholders of Dhampur.Spl.Sug. primarily consist of its promoters, with Sorabh Gupta holding the largest share at 43.35%. There are no pledged promoter holdings, and the company does not have any mutual funds or foreign institutional investors (FIIs) involved. The highest public shareholder is Sangeetha S, who holds 2.15%. Additionally, individual investors collectively own 37.27% of the company.

View full answer

What is the technical trend for Dhampur.Spl.Sug.?

09-Jun-2025

As of June 6, 2025, Dhampur.Spl.Sug. shows a mildly bearish trend, with weekly MACD and daily moving averages indicating bearishness, while mixed signals from Bollinger Bands and KST suggest a lack of strong momentum.

As of 6 June 2025, the technical trend for Dhampur.Spl.Sug. has changed from bearish to mildly bearish. The weekly MACD remains bearish, while the monthly MACD is mildly bearish, indicating a lack of strong upward momentum. The daily moving averages are bearish, further supporting the mildly bearish stance. The Bollinger Bands show a mildly bearish trend on the weekly chart but bullish on the monthly, suggesting some mixed signals. The KST is mildly bullish weekly but mildly bearish monthly, and Dow Theory also reflects a mildly bullish weekly but mildly bearish monthly outlook. Overall, the current technical stance is mildly bearish, with key indicators such as the weekly MACD and daily moving averages driving this assessment.

View full answer

Has Dhampur.Spl.Sug. declared dividend?

06-Jun-2025

Yes, Dhampur Speciality Sugars Ltd has declared an 8% dividend, amounting to 0.8000 per share, with an ex-date of September 23, 2014. However, the dividend yield is 0%, and total returns have shown significant price appreciation over various periods despite no recent dividend income.

Dhampure Speciality Sugars Ltd has declared an 8% dividend.<BR><BR>Dividend Details:<BR>- Percentage announced: 8%<BR>- Amount per share: 0.8000<BR>- Ex-date: 23 Sep 14<BR><BR>Dividend Yield: 0%<BR><BR>Total Returns by Period:<BR>In the 6-month period, the price return was -29.73%, the dividend return was 0%, resulting in a total return of -29.73%.<BR><BR>In the 1-year period, the price return was 5.36%, the dividend return was 0%, leading to a total return of 5.36%.<BR><BR>Over the 2-year period, the price return was 75.12%, with a dividend return of 0%, culminating in a total return of 75.12%.<BR><BR>In the 3-year period, the price return was 131.46%, the dividend return was 0%, resulting in a total return of 131.46%.<BR><BR>For the 4-year period, the price return was 164.35%, with a dividend return of 0%, leading to a total return of 164.35%.<BR><BR>In the 5-year period, the price return was 825.85%, the dividend return was 0%, resulting in a total return of 825.85%.<BR><BR>Overall, while Dhampure Speciality Sugars Ltd has declared a dividend, the dividend yield remains at 0%. The total returns over various periods indicate strong price appreciation, particularly over the longer term, despite the lack of additional dividend income in recent years.

View full answer
iScoreScore
Click here to find our call on this stock
Strong Sell
Sell
Hold
Buy
Strong Buy

Dashboard

1

The company is Net-Debt Free

 
2

Healthy long term growth as Operating profit has grown by an annual rate 54.73%

 
3

With a growth in Net Profit of 189.83%, the company declared Very Positive results in Jun 26

4

Majority shareholders : Promoters

 
5

Consistent Returns over the last 3 years

stock-summaryMojo Parameters

Mojo Parameters

Loading Valuation Snapshot...

Stock DNA

stock-summary
Industry

Sugar

stock-summary
Market cap

INR 131 Cr (Micro Cap)

stock-summary
P/E

20.00

stock-summary
Industry P/E

24

stock-summary
Dividend Yield

0.00%

stock-summary
Debt Equity

-0.17

stock-summary
Return on Equity

13.38%

stock-summary
Price to Book

3.17

Revenue and Profits:
Net Sales:
17 Cr
(Quarterly Results - Jun 2026)
Net Profit:
2 Cr
stock-summaryTotal Returns
Total Returns (Price + Dividend) stock-summary
Dividend Yield (0%)
TimePeriod
Price Return
Dividend Return
Total Return
3 Months
25.19%
0%
25.19%
6 Months
31.1%
0%
31.1%
1 Year
64.44%
0%
64.44%
2 Years
65.44%
0%
65.44%
3 Years
249.33%
0%
249.33%
4 Years
275.88%
0%
275.88%
5 Years
417.56%
0%
417.56%

Latest dividend: 0.8000 per share ex-dividend date: Sep-23-2014

Risk Adjusted Returns v/s stock-summary
Returns Beta
Icon
Beta has not been calculated since enough price history is not available
stock-summaryNews & Corporate Actions

News

Dhampure Speciality Sugars Surges 11.49%: 2 Key Factors Behind the Rally

Announcements stock-summary

Reg. 34 (1) Annual Report.

22-Aug-2026 | Source : BSE

Please find the Revised Annual Report for the Financial Year 2025-26.

Reg. 34 (1) Annual Report.

20-Aug-2026 | Source : BSE

Annual Report of the Company for the Financial Year 2025-26 as per Regulation 30 and 34 of the SEBI (Listing Obligations and Disclosure Requirements) Regulations 2015.

Notice Of Annual General Meeting Of The Company Scheduled On 15Th September 2026.

17-Aug-2026 | Source : BSE

Please find attached the Notice of Annual General Meeting of the Company Scheduled on 15th September 2026

Corporate Actions stock-summary

stock-summary
BOARD MEETING

No Upcoming Board Meetings

stock-summary
DIVIDEND

Dhampure Speciality Sugars Ltd has declared 8% dividend, ex-date: 23 Sep 14

stock-summary
SPLITS

No Splits history available

stock-summary
BONUS

No Bonus history available

stock-summary
RIGHTS

No Rights history available

stock-summaryKey Factors

Quality key factors stock-summary

Factor
Value
Sales Growth (5y)
29.67%
EBIT Growth (5y)
54.73%
EBIT to Interest (avg)
2.34
Debt to EBITDA (avg)
0.42
Net Debt to Equity (avg)
-0.17
Sales to Capital Employed (avg)
1.07
Tax Ratio
24.85%
Dividend Payout Ratio
0
Pledged Shares
0
Institutional Holding
0
ROCE (avg)
4.49%
ROE (avg)
6.92%

Valuation key factors

Factor
Value
P/E Ratio
20
Industry P/E
24
Price to Book Value
3.09
EV to EBIT
15.46
EV to EBITDA
14.74
EV to Capital Employed
3.52
EV to Sales
1.88
PEG Ratio
0.21
Dividend Yield
NA
ROCE (Latest)
19.54%
ROE (Latest)
13.38%

Technicals key factors

Indicator
Weekly
Monthly
MACD
Bullish
Bullish
RSI
Bearish
Bearish
Bollinger Bands
Mildly Bullish
Bullish
Moving Averages
Bullish (Daily)
KST
Bullish
Bullish
Dow Theory
No Trend
Bullish
stock-summary Technical Indicator Scale: Bearish, Mildly Bearish, Sideways, Mildly Bullish, Bullish  Turned 
stock-summaryShareholding
Shareholding Snapshot : Jun 2026stock-summary
Shareholding Compare (%holding) stock-summary
Majority shareholders

Promoters

Pledged Promoter Holdings

None

Mutual Funds

Held by 0 Schemes

FIIs

Held by 0 FIIs

Promoter with highest holding

Sorabh Gupta (42.51%)

Highest Public shareholder

Sangeetha S (2.01%)

Individual Investors Holdings

35.81%

stock-summaryFinancial
[
  {
    "link": "quarterly",
    "btn_text": "All Quarterly Results",
    "header": "Quarterly Results Snapshot (Consolidated) - Jun'26 - QoQ",
    "rhs": [
      {
        "prefix": "Net Sales ",
        "suffix": "QoQ Growth in quarter ended Jun 2026 is 0.64% vs 5.87% in Mar 2026",
        "dir": -1
      },
      {
        "prefix": "Consolidated Net Profit ",
        "suffix": "QoQ Growth in quarter ended Jun 2026 is 189.83% vs -71.08% in Mar 2026",
        "dir": 1
      }
    ],
    "table": {
      "header": [
        "Jun'26",
        "Mar'26",
        "Change(%)"
      ],
      "body": [
        {
          "field": "Net Sales",
          "val1": "17.42",
          "val2": "17.31",
          "chgp": "0.64%",
          "chgp_class": "positive"
        },
        {
          "field": "Operating Profit (PBDIT) excl Other Income",
          "val1": "2.24",
          "val2": "0.59",
          "chgp": "279.66%",
          "chgp_class": "positive"
        },
        {
          "field": "Interest",
          "val1": "0.03",
          "val2": "0.01",
          "chgp": "200.00%",
          "chgp_class": "negative"
        },
        {
          "field": "Exceptional Items",
          "val1": "0.00",
          "val2": "-0.15",
          "chgp": "100.00%",
          "chgp_class": "positive"
        },
        {
          "field": "Consolidate Net Profit",
          "val1": "1.71",
          "val2": "0.59",
          "chgp": "189.83%",
          "chgp_class": "positive"
        },
        {
          "field": "Operating Profit Margin (Excl OI)",
          "val1": "12.86%",
          "val2": "3.41%",
          "chgp": "9.45%",
          "chgp_class": "positive"
        }
      ]
    }
  },
  {
    "link": "half-yearly",
    "btn_text": "All Half Yearly Results",
    "header": "Half Yearly Results Snapshot (Consolidated) - Sep'25",
    "rhs": [
      {
        "prefix": "Net Sales ",
        "suffix": " Growth in half year ended Sep 2025 is 60.27% vs 26.68% in Sep 2024",
        "dir": 1
      },
      {
        "prefix": "Consolidated Net Profit ",
        "suffix": " Growth in half year ended Sep 2025 is 75.90% vs 41.88% in Sep 2024",
        "dir": 1
      }
    ],
    "table": {
      "header": [
        "Sep'25",
        "Sep'24",
        "Change(%)"
      ],
      "body": [
        {
          "field": "Net Sales",
          "val1": "24.73",
          "val2": "15.43",
          "chgp": "60.27%",
          "chgp_class": "positive"
        },
        {
          "field": "Operating Profit (PBDIT) excl Other Income",
          "val1": "4.21",
          "val2": "2.50",
          "chgp": "68.40%",
          "chgp_class": "positive"
        },
        {
          "field": "Interest",
          "val1": "0.01",
          "val2": "0.00",
          "chgp": "",
          "chgp_class": "neutral"
        },
        {
          "field": "Exceptional Items",
          "val1": "0.00",
          "val2": "0.00",
          "chgp": "",
          "chgp_class": "neutral"
        },
        {
          "field": "Consolidate Net Profit",
          "val1": "2.92",
          "val2": "1.66",
          "chgp": "75.90%",
          "chgp_class": "positive"
        },
        {
          "field": "Operating Profit Margin (Excl OI)",
          "val1": "17.02%",
          "val2": "16.20%",
          "chgp": "0.82%",
          "chgp_class": "positive"
        }
      ]
    }
  },
  {
    "link": "nine-monthly",
    "btn_text": "All Nine Monthly Results",
    "header": "Nine Monthly Results Snapshot (Consolidated) - Dec'25",
    "rhs": [
      {
        "prefix": "Net Sales ",
        "suffix": "YoY Growth in nine months ended Dec 2025 is 53.00% vs 29.58% in Dec 2024",
        "dir": 1
      },
      {
        "prefix": "Consolidated Net Profit ",
        "suffix": "YoY Growth in nine months ended Dec 2025 is 107.53% vs 39.77% in Dec 2024",
        "dir": 1
      }
    ],
    "table": {
      "header": [
        "Dec'25",
        "Dec'24",
        "Change(%)"
      ],
      "body": [
        {
          "field": "Net Sales",
          "val1": "41.08",
          "val2": "26.85",
          "chgp": "53.00%",
          "chgp_class": "positive"
        },
        {
          "field": "Operating Profit (PBDIT) excl Other Income",
          "val1": "6.68",
          "val2": "3.24",
          "chgp": "106.17%",
          "chgp_class": "positive"
        },
        {
          "field": "Interest",
          "val1": "0.01",
          "val2": "0.01",
          "chgp": "",
          "chgp_class": "neutral"
        },
        {
          "field": "Exceptional Items",
          "val1": "0.00",
          "val2": "0.00",
          "chgp": "",
          "chgp_class": "neutral"
        },
        {
          "field": "Consolidate Net Profit",
          "val1": "4.96",
          "val2": "2.39",
          "chgp": "107.53%",
          "chgp_class": "positive"
        },
        {
          "field": "Operating Profit Margin (Excl OI)",
          "val1": "16.26%",
          "val2": "12.07%",
          "chgp": "4.19%",
          "chgp_class": "positive"
        }
      ]
    }
  },
  {
    "link": "annual",
    "btn_text": "All Annual Results",
    "header": "Annual Results Snapshot (Consolidated) - Mar'26",
    "rhs": [
      {
        "prefix": "Net Sales ",
        "suffix": "YoY Growth in year ended Mar 2026 is 46.71% vs 36.16% in Mar 2025",
        "dir": 1
      },
      {
        "prefix": "Consolidated Net Profit ",
        "suffix": "YoY Growth in year ended Mar 2026 is 92.71% vs 209.68% in Mar 2025",
        "dir": -1
      }
    ],
    "table": {
      "header": [
        "Mar'26",
        "Mar'25",
        "Change(%)"
      ],
      "body": [
        {
          "field": "Net Sales",
          "val1": "58.39",
          "val2": "39.80",
          "chgp": "46.71%",
          "chgp_class": "positive"
        },
        {
          "field": "Operating Profit (PBDIT) excl Other Income",
          "val1": "7.28",
          "val2": "3.51",
          "chgp": "107.41%",
          "chgp_class": "positive"
        },
        {
          "field": "Interest",
          "val1": "0.02",
          "val2": "0.01",
          "chgp": "100.00%",
          "chgp_class": "negative"
        },
        {
          "field": "Exceptional Items",
          "val1": "-0.15",
          "val2": "0.23",
          "chgp": "-165.22%",
          "chgp_class": "negative"
        },
        {
          "field": "Consolidate Net Profit",
          "val1": "5.55",
          "val2": "2.88",
          "chgp": "92.71%",
          "chgp_class": "positive"
        },
        {
          "field": "Operating Profit Margin (Excl OI)",
          "val1": "12.47%",
          "val2": "8.82%",
          "chgp": "3.65%",
          "chgp_class": "positive"
        }
      ]
    }
  }
]

Quarterly Results Snapshot (Consolidated) - Jun'26 - QoQstock-summary

Jun'26
Mar'26
Change(%)
Net Sales
17.42
17.31
0.64%
Operating Profit (PBDIT) excl Other Income
2.24
0.59
279.66%
Interest
0.03
0.01
200.00%
Exceptional Items
0.00
-0.15
100.00%
Consolidate Net Profit
1.71
0.59
189.83%
Operating Profit Margin (Excl OI)
12.86%
3.41%
9.45%
Values in Rs Cr.
Direction Arrows
Net Sales

QoQ Growth in quarter ended Jun 2026 is 0.64% vs 5.87% in Mar 2026

Direction Arrows
Consolidated Net Profit

QoQ Growth in quarter ended Jun 2026 is 189.83% vs -71.08% in Mar 2026

Half Yearly Results Snapshot (Consolidated) - Sep'25stock-summary

Sep'25
Sep'24
Change(%)
Net Sales
24.73
15.43
60.27%
Operating Profit (PBDIT) excl Other Income
4.21
2.50
68.40%
Interest
0.01
0.00
Exceptional Items
0.00
0.00
Consolidate Net Profit
2.92
1.66
75.90%
Operating Profit Margin (Excl OI)
17.02%
16.20%
0.82%
Values in Rs Cr.
Direction Arrows
Net Sales

Growth in half year ended Sep 2025 is 60.27% vs 26.68% in Sep 2024

Direction Arrows
Consolidated Net Profit

Growth in half year ended Sep 2025 is 75.90% vs 41.88% in Sep 2024

Nine Monthly Results Snapshot (Consolidated) - Dec'25stock-summary

Dec'25
Dec'24
Change(%)
Net Sales
41.08
26.85
53.00%
Operating Profit (PBDIT) excl Other Income
6.68
3.24
106.17%
Interest
0.01
0.01
Exceptional Items
0.00
0.00
Consolidate Net Profit
4.96
2.39
107.53%
Operating Profit Margin (Excl OI)
16.26%
12.07%
4.19%
Values in Rs Cr.
Direction Arrows
Net Sales

YoY Growth in nine months ended Dec 2025 is 53.00% vs 29.58% in Dec 2024

Direction Arrows
Consolidated Net Profit

YoY Growth in nine months ended Dec 2025 is 107.53% vs 39.77% in Dec 2024

Annual Results Snapshot (Consolidated) - Mar'26stock-summary

Mar'26
Mar'25
Change(%)
Net Sales
58.39
39.80
46.71%
Operating Profit (PBDIT) excl Other Income
7.28
3.51
107.41%
Interest
0.02
0.01
100.00%
Exceptional Items
-0.15
0.23
-165.22%
Consolidate Net Profit
5.55
2.88
92.71%
Operating Profit Margin (Excl OI)
12.47%
8.82%
3.65%
Values in Rs Cr.
Direction Arrows
Net Sales

YoY Growth in year ended Mar 2026 is 46.71% vs 36.16% in Mar 2025

Direction Arrows
Consolidated Net Profit

YoY Growth in year ended Mar 2026 is 92.71% vs 209.68% in Mar 2025

stock-summaryCompany CV
About Dhampure Speciality Sugars Ltd stock-summary
stock-summary
Dhampure Speciality Sugars Ltd
Micro Cap
Sugar
Dhampure Specialty Sugars Limited, incorporated in 1992, is a leading manufacturer, processor, dealers, sellers, importers and exporters of sugar product of every kind and description including inverted sugar, raw sugar, gur, khandsari, processed or manufactured by use of any of the products, bye products wastes or scraps of sugar mills either with or without conjunction or mixture of any other material, article or thing. The Company is engaged in manufacturing of sugar.
Company Coordinates stock-summary
Company Details
Village Pallawala, Tehsil Dhampur Bijnor Uttar Pradesh : 246761
stock-summary
Tel:
stock-summary
investor@sugarindia.com
Registrar Details
MAS Services Ltd, T-34 , 2nd Floor, Okhla Industrial Area, Phase - II, New Delhi