
Compare Dhanuka Agritech with Similar Stocks
Stock DNA
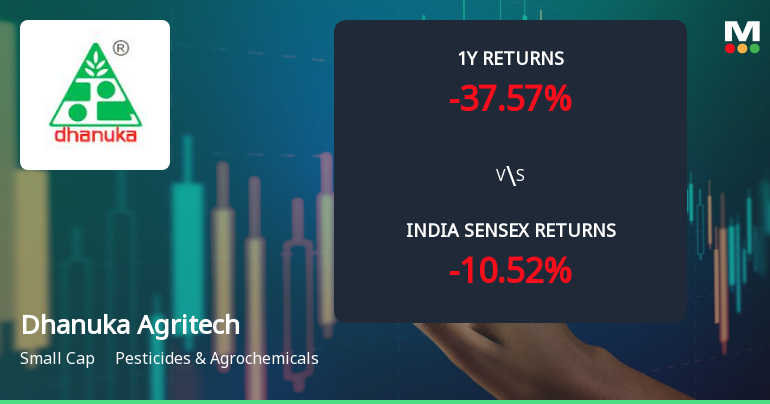
Pesticides & Agrochemicals
INR 4,774 Cr (Small Cap)
16.00
32
0.19%
-0.04
21.17%
3.36
Total Returns (Price + Dividend) 
Latest dividend: 2 per share ex-dividend date: Jul-18-2025
Risk Adjusted Returns v/s
Returns Beta

News
Dhanuka Agritech Ltd Technical Momentum Shifts Amid Bearish Sentiment
Dhanuka Agritech Ltd has experienced a notable shift in its technical momentum, with key indicators signalling a transition from a bearish to a mildly bearish trend. Despite a recent downgrade to a Sell rating by MarketsMOJO, the stock’s mixed technical signals and price action warrant a detailed analysis for investors navigating the volatile Pesticides & Agrochemicals sector.
Read full news article
Dhanuka Agritech Downgraded to Sell Amid Weak Technicals and Flat Financials
Dhanuka Agritech Ltd, a small-cap player in the Pesticides & Agrochemicals sector, has seen its investment rating downgraded from Hold to Sell as of 10 June 2026. The downgrade reflects deteriorating technical indicators, flat recent financial performance, and subdued long-term growth prospects, despite some strengths in management efficiency and valuation metrics.
Read full news article
Dhanuka Agritech Ltd Faces Bearish Momentum Amid Technical Downgrade
Dhanuka Agritech Ltd, a small-cap player in the Pesticides & Agrochemicals sector, has experienced a notable shift in its technical momentum, with key indicators signalling a bearish trend. The company’s stock price has declined by 1.65% today, reflecting broader technical weaknesses despite some mildly bullish weekly signals. This article analyses the recent technical parameter changes, price momentum, and the implications for investors amid a challenging market backdrop.
Read full news article Announcements
Announcement under Regulation 30 (LODR)-Newspaper Publication
08-Jun-2026 | Source : BSESubmission of Newspaper Advertisement pertaining to Public Notice for the Buyback of Fully Paid-up Equity Shares by the Company
Public Notice
08-Jun-2026 | Source : BSESundae Capital Advisors Pvt Ltd (Manager to the Buyback) has submitted to BSE a copy of Public Notice for the attention of the Public Shareholders of Dhanuka Agritech Ltd.
Updates on Buyback Offer
03-Jun-2026 | Source : BSESundae Capital Advisors Pvt Ltd (Manager to the Buyback) has submitted to BSE a copy of Offer Opening Advertisement cum corrigendum to the Public Announcement for the buyback of Equity Shares on a proportionate basis through tender offer under the Securities and Exchange Board of India (Buyback Of Securities) Regulations 2018 (SEBI Buyback Regulations) as amended for the attention of Equity Shareholders / Beneficial Owners Of The Equity Shares Of Dhanuka Agritech Ltd (Target Company).
Corporate Actions

No Upcoming Board Meetings

Dhanuka Agritech Ltd has declared 100% dividend, ex-date: 17 Jul 26

Dhanuka Agritech Ltd has announced 2:10 stock split, ex-date: 02 Sep 10

No Bonus history available

No Rights history available
Quality key factors
Valuation key factors
Technicals key factors
 Technical Indicator Scale: Bearish, Mildly Bearish, Sideways, Mildly Bullish, Bullish Turned
 Shareholding Snapshot : Mar 2026
Shareholding Compare (%holding)
Promoters
None
Held by 8 Schemes (16.38%)
Held by 57 FIIs (1.93%)
Triveni Trust (mahendra Kumar Dhanuka) (57.14%)
Dsp Small Cap Fund,dsp Midcap Fund, Dsp Business Cycle Fund (9.31%)
7.05%
Quarterly Results Snapshot (Standalone) - Mar'26 - YoY

YoY Growth in quarter ended Mar 2026 is 9.35% vs 20.01% in Mar 2025

YoY Growth in quarter ended Mar 2026 is 29.50% vs 27.92% in Mar 2025
Half Yearly Results Snapshot (Standalone) - Sep'25
Growth in half year ended Sep 2025 is -1.86% vs 16.30% in Sep 2024
Growth in half year ended Sep 2025 is -10.18% vs 23.53% in Sep 2024
Nine Monthly Results Snapshot (Standalone) - Dec'25
YoY Growth in nine months ended Dec 2025 is -3.56% vs 14.59% in Dec 2024
YoY Growth in nine months ended Dec 2025 is -14.44% vs 22.97% in Dec 2024
Annual Results Snapshot (Standalone) - Mar'26
YoY Growth in year ended Mar 2026 is -0.75% vs 15.73% in Mar 2025
YoY Growth in year ended Mar 2026 is -3.28% vs 24.20% in Mar 2025
About Dhanuka Agritech Ltd

Company Coordinates


