Rallis India

  • Market Cap: Small Cap
  • Industry: Pesticides & Agrochemicals
  • ISIN: INE613A01020
  • NSEID: RALLIS
  • BSEID: 500355
INR
217.40
0.2 (0.09%)
BSENSE

Aug 03, 03:32 PM

BSE+NSE Vol: 8.7 lacs

  • Price Points
  • Score
  • Mojo Parameters
  • Total Return
  • News and Corporate Actions
  • Key factors
  • Shareholding
  • Financials
  • CompanyCV
stock-summaryPrice Point
High/Low

1Day

52 Week

Valuation
Technical
Day's Volume

CASH

8.7 lacs (-3.46%) Volume

Shareholding (Jun 2026)

FII

9.12%

Held by 117 FIIs

DII

12.13%

Held by 16 DIIs

Promoter

55.08%

Why is Rallis India Ltd falling/rising?

02-Aug-2026

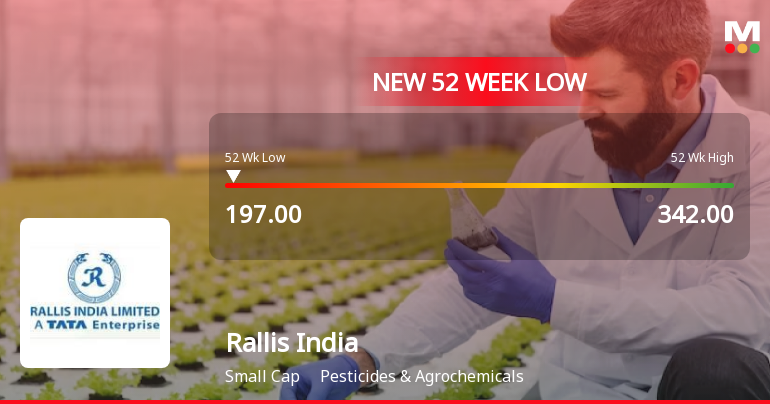
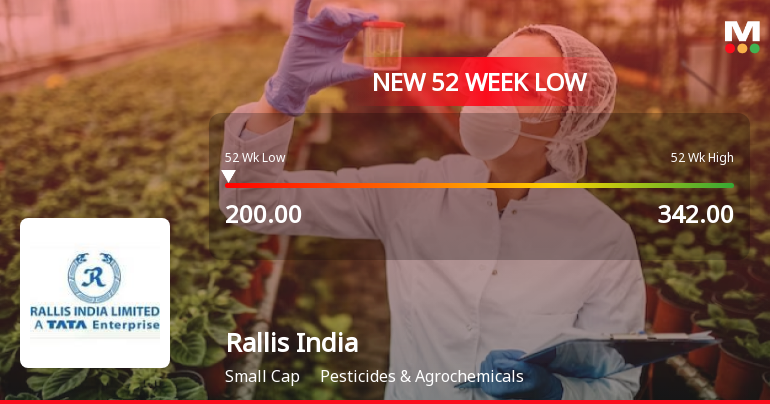
As of 02-Aug, Rallis India Ltd's stock price is slightly rising at 217.20, but it has significantly declined by 22.40% year-to-date and 42.26% over the past year. Despite recent positive quarterly results, long-term growth prospects are poor, and investor confidence is waning.

As of 02-Aug, Rallis India Ltd's stock price is experiencing a slight rise, currently at 217.20, with a change of 0.25 (0.12%) upwards. However, despite this minor increase, the stock has shown a significant decline over longer periods, with a year-to-date drop of 22.40% and a staggering 42.26% decrease over the past year. <BR><BR>The stock is currently trading close to its 52-week low, just 1.31% away from Rs 214.65. It has also been underperforming against the benchmark Sensex, which has risen by 2.68% over the past week, while Rallis India Ltd has fallen by 0.78%. Furthermore, the stock is trading below its moving averages across various time frames, indicating a bearish trend.<BR><BR>Investor participation has also declined, with delivery volume falling by 41.54% compared to the 5-day average, suggesting a lack of confidence among investors. Despite these challenges, the company has declared positive results for the last three consecutive quarters, showing growth in net sales and profits, and it is net-debt free, which are positive indicators. However, the long-term growth prospects remain poor, with net sales and operating profit growing at only 3.39% and 2.01% annually over the last five years, respectively.<BR><BR>In summary, while there is a slight uptick in the stock price on this particular day, the overall trend remains negative due to poor long-term growth, declining investor participation, and underperformance relative to benchmarks.

View full answer

Should I buy, sell or hold Rallis India Ltd?

21-Jul-2026

When is the next results date for Rallis India Ltd?

10-Jul-2026

The next results date for Rallis India Ltd is 20 July 2026.

The next results date for Rallis India Ltd is scheduled for 20 July 2026.

View full answer

How big is Rallis India?

11-Jun-2026

As of 10th June, Rallis India Ltd has a market capitalization of 4,491.00 Cr, with net sales of 2,603.93 Cr and a net profit of 164.20 Cr over the latest four quarters. The company has shareholder's funds of 1,696.65 Cr and total assets of 2,858.04 Cr.

As of 10th June, Rallis India Ltd has a market capitalization of 4,491.00 Cr, classifying it as a Small Cap company.<BR><BR>In the latest four quarters, Rallis India reported net sales of 2,603.93 Cr and a net profit of 164.20 Cr.<BR><BR>For the latest annual period, Rallis India has shareholder's funds amounting to 1,696.65 Cr and total assets of 2,858.04 Cr.

View full answer

Who are in the management team of Rallis India?

11-Jun-2026

The management team of Rallis India includes Sanjiv Lal (Managing Director & CEO), Bhaskar Bhat (Chairman), and several non-executive and independent directors, such as Punita Kumar Sinha and C V Natraj, along with Company Secretary Srikant Nair. This diverse team provides strong leadership for the company.

The management team of Rallis India includes the following key members:<BR><BR>1. **Sanjiv Lal** - Managing Director & CEO<BR>2. **Bhaskar Bhat** - Chairman (Non-Executive)<BR>3. **Punita Kumar Sinha** - Non-Executive & Independent Director<BR>4. **C V Natraj** - Non-Executive & Independent Director<BR>5. **Padmini Khare Kaicker** - Non-Executive & Independent Director<BR>6. **R Mukundan** - Non-Executive & Non-Independent Director<BR>7. **Srikant Nair** - Company Secretary & Compliance Officer<BR><BR>This team brings a diverse range of expertise to the company's leadership.

View full answer

Who are the peers of the Rallis India?

11-Jun-2026

Rallis India's peers include P I Industries, Sumitomo Chemical, Bayer CropScience, Sharda Cropchem, Dhanuka Agritech, NACL Industries, Bhagiradha Chemicals, Bharat Rasayan, and Insecticides India. Rallis India has average management risk and a 1-year return of -29.61%, better than Dhanuka Agritech's -36.93% but worse than Sharda Cropchem's 8.50%.

Peers: The peers of Rallis India are P I Industries, Sumitomo Chemi., Bayer CropSci., Sharda Cropchem, Dhanuka Agritech, NACL Industries, Bhagiradha Chem., Bharat Rasayan, and Insecticid.India.<BR><BR>Quality Snapshot: Excellent management risk is observed at Bayer CropSci. and Dhanuka Agritech, while Good management risk is found at P I Industries, Sumitomo Chemi., Sharda Cropchem, and the rest. Average management risk is present at Rallis India, NACL Industries, Bhagiradha Chem., Bharat Rasayan, and Insecticid.India. Growth is Excellent at Sharda Cropchem, while Below Average growth is noted for P I Industries, Sumitomo Chemi., Bayer CropSci., Dhanuka Agritech, Rallis India, NACL Industries, Bhagiradha Chem., Bharat Rasayan, and Insecticid.India. Capital Structure is Excellent at P I Industries, Sumitomo Chemi., Bayer CropSci., Sharda Cropchem, Dhanuka Agritech, Rallis India, Bharat Rasayan, and Insecticid.India, while Good is seen at Bhagiradha Chem. and Below Average at NACL Industries.<BR><BR>Return Snapshot: The peer with the highest 1-year return is Sharda Cropchem at 8.50%, while the lowest is Dhanuka Agritech at -36.93%. Rallis India has a 1-year return of -29.61%, which is better than Dhanuka Agritech but worse than Sharda Cropchem. Additionally, the six-month return is negative for Dhanuka Agritech, Bharat Rasayan, and Rallis India.

View full answer

What does Rallis India do?

10-Jun-2026

Rallis India Ltd, a Small Cap company under Tata Enterprise, specializes in agricultural inputs, particularly pesticides and agrochemicals. As of March 2026, it reported net sales of 456 Cr and a net loss of 15 Cr, with a market cap of INR 4,491 Cr.

Overview: <BR>Rallis India Ltd is a leading player in the agricultural inputs industry, categorized as a Small Cap company, specializing in pesticides and agrochemicals.<BR><BR>History: <BR>Rallis India Ltd was incorporated in 1964 and has been a part of the Tata Enterprise. The latest quarterly results reported are for March 2026, showing net sales and profit figures.<BR><BR>Financial Snapshot: <BR>Most recent Net Sales: 456 Cr (Quarterly Results - Mar 2026) <BR>Most recent Net Profit: -15 Cr (Quarterly Results - Mar 2026) <BR>Market-cap value: INR 4,491 Cr (Small Cap)<BR><BR>Key Metrics: <BR>P/E: 21.00 <BR>Industry P/E: 29 <BR>Dividend Yield: 1.30% <BR>Debt-Equity: -0.26 <BR>Return on Equity: 10.35% <BR>Price-to-Book: 2.20<BR><BR>Contact Details: <BR>Address: 23rd Floor Lodha Excelus, New Cuffe Parade Off EasternFr Mumbai Maharashtra : 400021 <BR>Tel: 91-22-6232-7400/6665-2700 <BR>Email: investor_relations@rallis.com <BR>Website: http://www.rallis.co.in

View full answer

Are Rallis India Ltd latest results good or bad?

21-Jan-2026

Rallis India Ltd's latest results show a mixed performance, with a 19.35% increase in net sales but an alarming 81.82% drop in net profit, indicating significant operational challenges and low return on equity. Overall, the financial health appears concerning despite some sales growth.

Rallis India Ltd's latest results indicate a mixed performance, but overall, they lean towards the negative side. While the company reported a year-on-year growth in net sales of 19.35% for the quarter ended December 2025, this was overshadowed by a significant decline in standalone net profit, which plummeted by 81.82%. <BR><BR>The operating profit margin, although showing a slight improvement to 9.31%, still reflects ongoing challenges in maintaining profitability. This stark contrast between rising sales and falling profits suggests that the company is facing substantial cost pressures or operational inefficiencies.<BR><BR>In the broader context, Rallis India has struggled with profitability and growth in recent years, as evidenced by its declining operating margins and negative EBIT growth over the past five years. The return on equity remains low at 8.37%, which is below industry standards, indicating that the company is not utilizing its capital effectively compared to its peers.<BR><BR>Overall, while there are some positive signs in terms of sales growth, the sharp decline in profits and ongoing operational challenges paint a concerning picture for Rallis India Ltd's financial health.

View full answer

Is Rallis India technically bullish or bearish?

25-Nov-2025

As of November 24, 2025, Rallis India is in a bearish trend with moderate strength, indicated by bearish signals from the weekly MACD, Bollinger Bands, and daily moving averages, along with underperformance relative to the Sensex over various time frames.

As of 24 November 2025, the technical trend for Rallis India has changed from mildly bearish to bearish. The current stance is bearish with moderate strength. Key indicators driving this include the weekly MACD and Bollinger Bands both signaling bearish conditions, alongside daily moving averages also indicating a bearish trend. The monthly KST and Dow Theory are mildly bearish, further supporting the overall bearish outlook. The stock's performance relative to the Sensex shows significant underperformance over multiple time frames, particularly in the 1-month and 1-year periods.

View full answer

How has been the historical performance of Rallis India?

16-Oct-2025

Rallis India has shown consistent growth in net sales, increasing from 1,768.20 Cr in Mar'17 to 2,603.93 Cr in Mar'22, but faced declines in operating profit and net profit during the same period. Total assets rose significantly, while cash flow from operating activities decreased, indicating challenges in cash generation despite expanding operations.

Answer:<BR>The historical performance of Rallis India shows a consistent growth trend in net sales and total operating income over the past several years, with net sales increasing from 1,768.20 Cr in Mar'17 to 2,603.93 Cr in Mar'22. However, the operating profit (PBDIT) has seen fluctuations, peaking at 363.34 Cr in Mar'21 before declining to 301.52 Cr in Mar'22. Profit before tax also experienced a decline from 303.51 Cr in Mar'21 to 222.42 Cr in Mar'22, leading to a decrease in profit after tax from 228.58 Cr to 164.20 Cr in the same period. Despite these profit declines, the company has maintained a steady increase in total assets, which rose from 1,709.06 Cr in Mar'17 to 2,858.04 Cr in Mar'22, while total liabilities also increased from 1,398.76 Cr to 2,588.62 Cr over the same timeframe. Cash flow from operating activities has decreased from 407.65 Cr in Mar'17 to 165.00 Cr in Mar'22, indicating a reduction in cash generation capacity.<BR><BR>Breakdown:<BR>Rallis India has demonstrated a strong upward trajectory in net sales, which grew from 1,768.20 Cr in Mar'17 to 2,603.93 Cr in Mar'22, reflecting a robust demand for its products. However, the operating profit (PBDIT) peaked at 363.34 Cr in Mar'21 before declining to 301.52 Cr in Mar'22, indicating challenges in maintaining profitability. The profit before tax followed a similar trend, decreasing from 303.51 Cr in Mar'21 to 222.42 Cr in Mar'22, which contributed to a drop in profit after tax from 228.58 Cr to 164.20 Cr. On the balance sheet, total assets increased significantly from 1,709.06 Cr to 2,858.04 Cr, while total liabilities also rose from 1,398.76 Cr to 2,588.62 Cr, suggesting a growing leverage position. The cash flow from operating activities has notably decreased from 407.65 Cr in Mar'17 to 165.00 Cr in Mar'22, highlighting a decline in the company's cash generation ability amidst its expanding operations.

View full answer

Is Rallis India overvalued or undervalued?

29-Aug-2025

As of August 28, 2025, Rallis India is fairly valued with a PE ratio of 38.85 and an EV to EBITDA of 18.25, despite recent short-term underperformance, having a year-to-date return of 15.02% compared to the Sensex's 2.48%.

As of 28 August 2025, Rallis India has moved from an expensive to a fair valuation grade. The company is currently fairly valued, with a PE ratio of 38.85, an EV to EBITDA of 18.25, and a PEG ratio of 1.33. In comparison to its peers, P I Industries is considered very expensive with a PE of 34.92 and an EV to EBITDA of 24.91, while UPL is rated attractive with a PE of 35.84 and an EV to EBITDA of 8.75.<BR><BR>Despite recent underperformance, with a 1-week return of -8.81% compared to the Sensex's -2.34%, Rallis India has shown a year-to-date return of 15.02%, outperforming the Sensex's 2.48%. This suggests that while the stock has faced short-term challenges, its overall valuation remains reasonable within the context of its industry.

View full answer

Who are the top shareholders of the Rallis India?

17-Jul-2025

The top shareholders of Rallis India are Tata Chemicals Limited with 55.04%, followed by mutual funds at 12.49%, foreign institutional investors at 11.41%, and SBI Mutual Fund as the highest public shareholder at 9.43%. Individual investors hold 15.65% of the shares.

The top shareholders of Rallis India include Tata Chemicals Limited, which holds the largest stake at 55.04%. Other significant shareholders are mutual funds, which collectively hold 12.49% through 10 different schemes, and foreign institutional investors (FIIs), who hold 11.41% across 107 entities. The highest public shareholder is SBI Mutual Fund, with various funds accounting for 9.43%. Additionally, individual investors hold 15.65% of the company's shares.

View full answer

What is the bonus history of the Rallis India?

06-Jun-2025

Rallis India issued a bonus in the ratio of 1:2 on June 8, 2010, meaning shareholders received one additional share for every two shares held, with a record date of June 9, 2010. This is the most recent bonus issue for the company.

Rallis India has a bonus history that includes a significant event on June 8, 2010, when the company announced a bonus issue in the ratio of 1:2. This means that for every two shares held, shareholders received one additional share. The record date for this bonus issue was June 9, 2010. This was the latest bonus issue recorded for Rallis India. If you have any more questions about the company or its financials, feel free to ask!

View full answer

Has Rallis India declared dividend?

06-Jun-2025

Yes, Rallis India Ltd has declared a 250% dividend, amounting to ₹2.5 per share, with an ex-date of June 5, 2025. The company has shown positive total returns, particularly a 19.36% return over the past year and 69.85% over the last two years.

Rallis India Ltd has declared a 250% dividend.<BR><BR>Dividend Details:<BR>- Percentage announced: 250%<BR>- Amount per share: 2.5<BR>- Ex-date: Jun-05-2025<BR><BR>Dividend Yield: 0.79%.<BR><BR>Total Returns by Period:<BR>In the last 6 months, Rallis India experienced a price return of -6.01%, a dividend return of 0.76%, resulting in a total return of -5.25%.<BR><BR>Over the past year, the company achieved a price return of 18.57%, with a dividend return of 0.79%, leading to a total return of 19.36%.<BR><BR>In the 2-year period, Rallis India saw a price return of 67.27% and a dividend return of 2.58%, culminating in a total return of 69.85%.<BR><BR>For the 3-year period, the price return was 57.98%, the dividend return was 2.65%, which resulted in a total return of 60.63%.<BR><BR>In the last 4 years, the company had a price return of -0.46%, a dividend return of 2.44%, resulting in a total return of 1.98%.<BR><BR>Over the 5-year period, Rallis India recorded a price return of 33.9%, a dividend return of 4.05%, leading to a total return of 37.95%.<BR><BR>Overall, Rallis India has declared a significant dividend and has shown positive total returns over multiple periods, particularly in the 1-year and 2-year spans, indicating a favorable performance for investors.

View full answer
iScoreScore
Click here to find our call on this stock
Strong Sell
Sell
Hold
Buy
Strong Buy

Dashboard

1

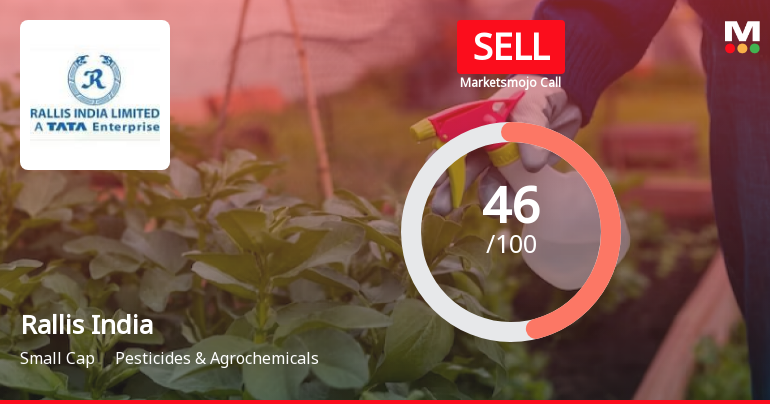
Poor long term growth as Net Sales has grown by an annual rate of 3.39% and Operating profit at 2.01% over the last 5 years

 
2

Below par performance in long term as well as near term

stock-summaryMojo Parameters

Mojo Parameters

Loading Valuation Snapshot...

Stock DNA

stock-summary
Industry

Pesticides & Agrochemicals

stock-summary
Market cap

INR 4,273 Cr (Small Cap)

stock-summary
P/E

18.00

stock-summary
Industry P/E

28

stock-summary
Dividend Yield

1.38%

stock-summary
Debt Equity

-0.26

stock-summary
Return on Equity

11.75%

stock-summary
Price to Book

2.07

Revenue and Profits:
Net Sales:
1,022 Cr
(Quarterly Results - Jun 2026)
Net Profit:
125 Cr
stock-summaryTotal Returns
Total Returns (Price + Dividend) stock-summary
Dividend Yield (1.38%)
TimePeriod
Price Return
Dividend Return
Total Return
3 Months
-18.07%
1.13%
-16.94%
6 Months
-19.59%
1.09%
-18.5%
1 Year
-40.76%
0.84%
-39.92%
2 Years
-36.04%
1.64%
-34.4%
3 Years
1.83%
3.72%
5.55%
4 Years
-0.05%
3.57%
3.52%
5 Years
-31.72%
3.94%
-27.78%

Latest dividend: 3 per share ex-dividend date: Jun-04-2026

Risk Adjusted Returns v/s stock-summary
Returns Beta
Icon
Beta has not been calculated since enough price history is not available
stock-summaryNews & Corporate Actions

Announcements stock-summary

Announcement under Regulation 30 (LODR)-Newspaper Publication

29-Jul-2026 | Source : BSE

Newspaper Advertisement for special window for relodgement of transfer requests of physical shares

Announcement under Regulation 30 (LODR)-Earnings Call Transcript

27-Jul-2026 | Source : BSE

Enclosed herewith is the Transcript of the Earnings Call on July 21 2026

Announcement under Regulation 30 (LODR)-Appointment of Statutory Auditor/s

27-Jul-2026 | Source : BSE

Appointment of the Statutory Auditors of the Company

Corporate Actions stock-summary

stock-summary
BOARD MEETING

No Upcoming Board Meetings

stock-summary
DIVIDEND

Rallis India Ltd has declared 300% dividend, ex-date: 04 Jun 26

stock-summary
SPLITS

Rallis India Ltd has announced 1:10 stock split, ex-date: 15 Jul 11

stock-summary
BONUS

Rallis India Ltd has announced 1:2 bonus issue, ex-date: 08 Jun 10

stock-summary
RIGHTS

No Rights history available

stock-summaryKey Factors

Quality key factors stock-summary

Factor
Value
Sales Growth (5y)
3.39%
EBIT Growth (5y)
2.01%
EBIT to Interest (avg)
21.34
Debt to EBITDA (avg)
0.37
Net Debt to Equity (avg)
-0.26
Sales to Capital Employed (avg)
1.42
Tax Ratio
25.95%
Dividend Payout Ratio
31.73%
Pledged Shares
0
Institutional Holding
21.25%
ROCE (avg)
12.11%
ROE (avg)
7.98%

Valuation key factors

Factor
Value
P/E Ratio
18
Industry P/E
28
Price to Book Value
2.07
EV to EBIT
13.27
EV to EBITDA
9.32
EV to Capital Employed
2.46
EV to Sales
1.25
PEG Ratio
0.44
Dividend Yield
1.38%
ROCE (Latest)
13.98%
ROE (Latest)
11.75%

Technicals key factors

Indicator
Weekly
Monthly
MACD
Bearish
Bearish
RSI
Bullish
No Signal
Bollinger Bands
Bearish
Bearish
Moving Averages
Bearish (Daily)
KST
Bearish
Bearish
Dow Theory
Mildly Bearish
Mildly Bearish
OBV
No Trend
No Trend
stock-summary Technical Indicator Scale: Bearish, Mildly Bearish, Sideways, Mildly Bullish, Bullish  Turned 
stock-summaryShareholding
Shareholding Snapshot : Jun 2026stock-summary
Shareholding Compare (%holding) stock-summary
Majority shareholders

Promoters

Pledged Promoter Holdings

None

Mutual Funds

Held by 10 Schemes (9.41%)

FIIs

Held by 117 FIIs (9.12%)

Promoter with highest holding

Tata Chemicals Limited (55.04%)

Highest Public shareholder

Sbi Mutual Fund (various Funds) (8.3%)

Individual Investors Holdings

19.43%

stock-summaryFinancial
[
  {
    "link": "quarterly",
    "btn_text": "All Quarterly Results",
    "header": "Quarterly Results Snapshot (Standalone) - Jun'26 - YoY",
    "rhs": [
      {
        "prefix": "Net Sales ",
        "suffix": "YoY Growth in quarter ended Jun 2026 is 6.79% vs 22.22% in Jun 2025",
        "dir": -1
      },
      {
        "prefix": "Standalone Net Profit ",
        "suffix": "YoY Growth in quarter ended Jun 2026 is 31.58% vs 97.92% in Jun 2025",
        "dir": -1
      }
    ],
    "table": {
      "header": [
        "Jun'26",
        "Jun'25",
        "Change(%)"
      ],
      "body": [
        {
          "field": "Net Sales",
          "val1": "1,022.00",
          "val2": "957.00",
          "chgp": "6.79%",
          "chgp_class": "positive"
        },
        {
          "field": "Operating Profit (PBDIT) excl Other Income",
          "val1": "185.00",
          "val2": "150.00",
          "chgp": "23.33%",
          "chgp_class": "positive"
        },
        {
          "field": "Interest",
          "val1": "2.00",
          "val2": "4.00",
          "chgp": "-50.00%",
          "chgp_class": "positive"
        },
        {
          "field": "Exceptional Items",
          "val1": "2.00",
          "val2": "0.00",
          "chgp": "",
          "chgp_class": "neutral"
        },
        {
          "field": "Standalone Net Profit",
          "val1": "125.00",
          "val2": "95.00",
          "chgp": "31.58%",
          "chgp_class": "positive"
        },
        {
          "field": "Operating Profit Margin (Excl OI)",
          "val1": "18.10%",
          "val2": "15.67%",
          "chgp": "2.43%",
          "chgp_class": "positive"
        }
      ]
    }
  },
  {
    "link": "half-yearly",
    "btn_text": "All Half Yearly Results",
    "header": "Half Yearly Results Snapshot (Standalone) - Sep'25",
    "rhs": [
      {
        "prefix": "Net Sales ",
        "suffix": " Growth in half year ended Sep 2025 is 6.25% vs 6.01% in Sep 2024",
        "dir": 1
      },
      {
        "prefix": "Standalone Net Profit ",
        "suffix": " Growth in half year ended Sep 2025 is 34.93% vs 0.69% in Sep 2024",
        "dir": 1
      }
    ],
    "table": {
      "header": [
        "Sep'25",
        "Sep'24",
        "Change(%)"
      ],
      "body": [
        {
          "field": "Net Sales",
          "val1": "1,818.00",
          "val2": "1,711.00",
          "chgp": "6.25%",
          "chgp_class": "positive"
        },
        {
          "field": "Operating Profit (PBDIT) excl Other Income",
          "val1": "304.00",
          "val2": "262.00",
          "chgp": "16.03%",
          "chgp_class": "positive"
        },
        {
          "field": "Interest",
          "val1": "7.00",
          "val2": "8.00",
          "chgp": "-12.50%",
          "chgp_class": "positive"
        },
        {
          "field": "Exceptional Items",
          "val1": "6.00",
          "val2": "0.00",
          "chgp": "",
          "chgp_class": "neutral"
        },
        {
          "field": "Standalone Net Profit",
          "val1": "197.00",
          "val2": "146.00",
          "chgp": "34.93%",
          "chgp_class": "positive"
        },
        {
          "field": "Operating Profit Margin (Excl OI)",
          "val1": "16.72%",
          "val2": "15.31%",
          "chgp": "1.41%",
          "chgp_class": "positive"
        }
      ]
    }
  },
  {
    "link": "nine-monthly",
    "btn_text": "All Nine Monthly Results",
    "header": "Nine Monthly Results Snapshot (Standalone) - Dec'25",
    "rhs": [
      {
        "prefix": "Net Sales ",
        "suffix": "YoY Growth in nine months ended Dec 2025 is 9.31% vs 0.95% in Dec 2024",
        "dir": 1
      },
      {
        "prefix": "Standalone Net Profit ",
        "suffix": "YoY Growth in nine months ended Dec 2025 is 26.75% vs -7.10% in Dec 2024",
        "dir": 1
      }
    ],
    "table": {
      "header": [
        "Dec'25",
        "Dec'24",
        "Change(%)"
      ],
      "body": [
        {
          "field": "Net Sales",
          "val1": "2,441.00",
          "val2": "2,233.00",
          "chgp": "9.31%",
          "chgp_class": "positive"
        },
        {
          "field": "Operating Profit (PBDIT) excl Other Income",
          "val1": "362.00",
          "val2": "306.00",
          "chgp": "18.30%",
          "chgp_class": "positive"
        },
        {
          "field": "Interest",
          "val1": "9.00",
          "val2": "10.00",
          "chgp": "-10.00%",
          "chgp_class": "positive"
        },
        {
          "field": "Exceptional Items",
          "val1": "-29.00",
          "val2": "0.00",
          "chgp": "",
          "chgp_class": "neutral"
        },
        {
          "field": "Standalone Net Profit",
          "val1": "199.00",
          "val2": "157.00",
          "chgp": "26.75%",
          "chgp_class": "positive"
        },
        {
          "field": "Operating Profit Margin (Excl OI)",
          "val1": "14.83%",
          "val2": "13.70%",
          "chgp": "1.13%",
          "chgp_class": "positive"
        }
      ]
    }
  },
  {
    "link": "annual",
    "btn_text": "All Annual Results",
    "header": "Annual Results Snapshot (Standalone) - Mar'26",
    "rhs": [
      {
        "prefix": "Net Sales ",
        "suffix": "YoY Growth in year ended Mar 2026 is 8.79% vs 0.57% in Mar 2025",
        "dir": 1
      },
      {
        "prefix": "Standalone Net Profit ",
        "suffix": "YoY Growth in year ended Mar 2026 is 47.20% vs -15.54% in Mar 2025",
        "dir": 1
      }
    ],
    "table": {
      "header": [
        "Mar'26",
        "Mar'25",
        "Change(%)"
      ],
      "body": [
        {
          "field": "Net Sales",
          "val1": "2,897.00",
          "val2": "2,663.00",
          "chgp": "8.79%",
          "chgp_class": "positive"
        },
        {
          "field": "Operating Profit (PBDIT) excl Other Income",
          "val1": "361.00",
          "val2": "286.00",
          "chgp": "26.22%",
          "chgp_class": "positive"
        },
        {
          "field": "Interest",
          "val1": "10.00",
          "val2": "12.00",
          "chgp": "-16.67%",
          "chgp_class": "positive"
        },
        {
          "field": "Exceptional Items",
          "val1": "-26.00",
          "val2": "1.00",
          "chgp": "-2,700.00%",
          "chgp_class": "negative"
        },
        {
          "field": "Standalone Net Profit",
          "val1": "184.00",
          "val2": "125.00",
          "chgp": "47.20%",
          "chgp_class": "positive"
        },
        {
          "field": "Operating Profit Margin (Excl OI)",
          "val1": "12.46%",
          "val2": "10.74%",
          "chgp": "1.72%",
          "chgp_class": "positive"
        }
      ]
    }
  }
]

Quarterly Results Snapshot (Standalone) - Jun'26 - YoYstock-summary

Jun'26
Jun'25
Change(%)
Net Sales
1,022.00
957.00
6.79%
Operating Profit (PBDIT) excl Other Income
185.00
150.00
23.33%
Interest
2.00
4.00
-50.00%
Exceptional Items
2.00
0.00
Standalone Net Profit
125.00
95.00
31.58%
Operating Profit Margin (Excl OI)
18.10%
15.67%
2.43%
Values in Rs Cr.
Direction Arrows
Net Sales

YoY Growth in quarter ended Jun 2026 is 6.79% vs 22.22% in Jun 2025

Direction Arrows
Standalone Net Profit

YoY Growth in quarter ended Jun 2026 is 31.58% vs 97.92% in Jun 2025

Half Yearly Results Snapshot (Standalone) - Sep'25stock-summary

Sep'25
Sep'24
Change(%)
Net Sales
1,818.00
1,711.00
6.25%
Operating Profit (PBDIT) excl Other Income
304.00
262.00
16.03%
Interest
7.00
8.00
-12.50%
Exceptional Items
6.00
0.00
Standalone Net Profit
197.00
146.00
34.93%
Operating Profit Margin (Excl OI)
16.72%
15.31%
1.41%
Values in Rs Cr.
Direction Arrows
Net Sales

Growth in half year ended Sep 2025 is 6.25% vs 6.01% in Sep 2024

Direction Arrows
Standalone Net Profit

Growth in half year ended Sep 2025 is 34.93% vs 0.69% in Sep 2024

Nine Monthly Results Snapshot (Standalone) - Dec'25stock-summary

Dec'25
Dec'24
Change(%)
Net Sales
2,441.00
2,233.00
9.31%
Operating Profit (PBDIT) excl Other Income
362.00
306.00
18.30%
Interest
9.00
10.00
-10.00%
Exceptional Items
-29.00
0.00
Standalone Net Profit
199.00
157.00
26.75%
Operating Profit Margin (Excl OI)
14.83%
13.70%
1.13%
Values in Rs Cr.
Direction Arrows
Net Sales

YoY Growth in nine months ended Dec 2025 is 9.31% vs 0.95% in Dec 2024

Direction Arrows
Standalone Net Profit

YoY Growth in nine months ended Dec 2025 is 26.75% vs -7.10% in Dec 2024

Annual Results Snapshot (Standalone) - Mar'26stock-summary

Mar'26
Mar'25
Change(%)
Net Sales
2,897.00
2,663.00
8.79%
Operating Profit (PBDIT) excl Other Income
361.00
286.00
26.22%
Interest
10.00
12.00
-16.67%
Exceptional Items
-26.00
1.00
-2,700.00%
Standalone Net Profit
184.00
125.00
47.20%
Operating Profit Margin (Excl OI)
12.46%
10.74%
1.72%
Values in Rs Cr.
Direction Arrows
Net Sales

YoY Growth in year ended Mar 2026 is 8.79% vs 0.57% in Mar 2025

Direction Arrows
Standalone Net Profit

YoY Growth in year ended Mar 2026 is 47.20% vs -15.54% in Mar 2025

stock-summaryCompany CV
About Rallis India Ltd stock-summary
stock-summary
Rallis India Ltd
Small Cap
Pesticides & Agrochemicals
Rallis India Limited is a leading player in the agricultural inputs industry. Being as Tata Enterprise since 1964, the Company is a leading crop inputs company with presence across the agricultural input value chain. It markets products for each step of crop cycle to facilitate an integrated crop management system and increase agricultural yield and farm income. It has a diversified portfolio and a channel network of 4,975 dealers and 63,000 retailers.
Company Coordinates stock-summary
Company Details
23rd Floor Lodha Excelus, New Cuffe Parade Off EasternFr Mumbai Maharashtra : 400021
stock-summary
Tel: 91-22-6232-7400/6665-2700
stock-summary
investor_relations@rallis.com
Registrar Details
TSR Darashaw Ltd, 6-10 , Haji Moosa Patrawala Indl. Est , 20 Dr.E.Moses Road , Mahalaxmi , Mumbai