Dharmaj Crop

  • Market Cap: Micro Cap
  • Industry: Pesticides & Agrochemicals
  • ISIN: INE00OQ01016
  • NSEID: DHARMAJ
  • BSEID: 543687
INR
243.05
3.45 (1.44%)
BSENSE

Apr 06

BSE+NSE Vol: 50.66 k

  • Price Points
  • Score
  • Mojo Parameters
  • Total Return
  • News and Corporate Actions
  • Key factors
  • Shareholding
  • Financials
  • CompanyCV
stock-summaryPrice Point
High/Low

1Day

52 Week

Valuation
Technical
Day's Volume

CASH

50.66 k (-22.63%) Volume

Shareholding (Dec 2025)

FII

3.49%

Held by 7 FIIs

DII

0.47%

Held by 0 DIIs

Promoter

70.40%

how big is Dharmaj Crop?

06-Jun-2025

As of Jun 06, Dharmaj Crop Guard Ltd has a market capitalization of 862.00 Cr, classifying it as a Micro Cap company, with recent net sales of 951.05 Cr and a net profit of 34.83 Cr over the last four quarters.

Market Cap: As of Jun 06, Dharmaj Crop Guard Ltd has a market capitalization of 862.00 Cr, which classifies it as a Micro Cap company.<BR><BR>Recent Quarterly Performance: The sum of Net Sales for the latest 4 quarters, which includes Mar'25, Dec'24, Sep'24, and Jun'24, is 951.05 Cr. The sum of Net Profit for the same period is 34.83 Cr. This data is based on Standalone financials.<BR><BR>Balance Sheet Snapshot: This is based on Standalone data for the reporting period of Mar'24. The Shareholder's Funds amount to 359.37 Cr, and the Total Assets are valued at 562.97 Cr.

View full answer

Who are in the management team of Dharmaj Crop?

06-Jun-2025

As of March 2022, the management team of Dharmaj Crop includes Rameshbhai Ravajibhai Talavia (Chairman & Managing Director), Jamankumar Hansarajbhai Talavia and Jagdishbhai Ravjibhai Savaliya (Whole Time Directors), and independent directors Deepak Bachubhai Kanparia, Bhaveshkumar Jayantibhai Ponkiya, and Amisha Fenil Shah. They oversee the company's operations and strategic direction.

As of March 2022, the management team of Dharmaj Crop consists of the following individuals:<BR><BR>1. Rameshbhai Ravajibhai Talavia - Chairman & Managing Director<BR>2. Jamankumar Hansarajbhai Talavia - Whole Time Director<BR>3. Jagdishbhai Ravjibhai Savaliya - Whole Time Director<BR>4. Deepak Bachubhai Kanparia - Independent Director<BR>5. Bhaveshkumar Jayantibhai Ponkiya - Independent Director<BR>6. Amisha Fenil Shah - Independent Director<BR><BR>This team is responsible for overseeing the company's operations and strategic direction.

View full answer

When is the next results date for Dharmaj Crop?

06-Jun-2025

No Upcoming Board Meetings

Has Dharmaj Crop declared dividend?

06-Jun-2025

No Dividend History Available

Who are the peers of the Dharmaj Crop?

16-Jul-2025

Dharmaj Crop's peers include Meghmani Organics, India Pesticides, Astec Lifesciences, and others, with varying management and capital structure risks. Dharmaj Crop shows average growth and a 1-year return of 15.02%, outperforming peers like Punjab Chemicals and Astec Lifesciences.

Peers: The peers of Dharmaj Crop are Meghmani Organi., India Pesticides, Astec Lifescienc, Punjab Chemicals, Heranba Inds, Best Agrolife, Shivalik Rasayan, Ambey Laborator., and Crop Life Scienc.<BR><BR>Quality Snapshot: Excellent management risk is observed at India Pesticides and Best Agrolife, while Good management risk is found at Heranba Inds and Ambey Laborator. Average management risk is present at Dharmaj Crop, Punjab Chemicals, and Crop Life Scienc, while Below Average management risk is noted at Meghmani Organi., Astec Lifescienc, and Shivalik Rasayan. In terms of Growth, Excellent growth is not observed among peers, while Average growth is found at Dharmaj Crop, and the rest exhibit Below Average growth. For Capital Structure, Excellent capital structure is noted at India Pesticides and Shivalik Rasayan, Good capital structure is found at Heranba Inds and Punjab Chemicals, while Average capital structure is present at Dharmaj Crop, Astec Lifescienc, and Best Agrolife, and Below Average capital structure is seen at Aristo Bio-Tech.<BR><BR>Return Snapshot: The peer with the highest 1-year return is Punjab Chemicals at -6.85%, while Astec Lifescienc has the lowest at -30.39%. Dharmaj Crop's 1-year return of 15.02% is significantly higher than both. Additionally, peers such as Best Agrolife, Shivalik Rasayan, and Aristo Bio-Tech have negative six-month returns.

View full answer

What does Dharmaj Crop do?

17-Jul-2025

Dharmaj Crop Guard Ltd is an agrochemical company that manufactures pesticides, including insecticides and herbicides. As of March 2025, it reported net sales of INR 2,099 Cr and a net loss of INR 24 Cr, with a market cap of INR 1,172 Cr.

Overview:<BR>Dharmaj Crop Guard Ltd is an agrochemical company engaged in the manufacturing and dealing of pesticides, including public health products for pest control, insecticides, herbicides, fertilizers, and related research and technical formulations, operating in the small-cap pesticides and agrochemicals industry.<BR><BR>History:<BR>Dharmaj Crop Guard Ltd was incorporated as a Public Limited Company on January 19, 2015, under the Companies Act, 2013. The latest quarterly results reported net sales and profit for the period ending March 2025.<BR><BR>Financial Snapshot:<BR>Most recent Net Sales: 2,099 Cr (Quarterly Results - Mar 2025) <BR>Most recent Net Profit: -24 Cr (Quarterly Results - Mar 2025) <BR>Market-cap value: INR 1,172 Cr (Small Cap)<BR><BR>Key Metrics:<BR>P/E: 33.00 <BR>Industry P/E: 40 <BR>Dividend Yield: 0.00% <BR>Debt-Equity: 0.34 <BR>Return on Equity: 8.81% <BR>Price to Book: 2.96 <BR><BR>Contact Details:<BR>No Company Details Available <BR>Registrar Address: Not available.

View full answer

Who are the top shareholders of the Dharmaj Crop?

17-Jul-2025

The top shareholders of Dharmaj Crop include promoter Talavia Rameshbhai Ravajibhai with 26.67%, 10 Foreign Institutional Investors holding 4.14%, and Unico Global Opportunities Fund Limited as the largest public shareholder at 2.31%. Individual investors collectively own 19.98% of the shares.

The top shareholders of Dharmaj Crop include the promoters, who hold the majority of the shares. The promoter with the highest holding is Talavia Rameshbhai Ravajibhai, who owns 26.67% of the company. Additionally, there are 10 Foreign Institutional Investors (FIIs) that collectively hold 4.14% of the shares. The highest public shareholder is Unico Global Opportunities Fund Limited, which holds 2.31%. Individual investors also have a significant presence, holding 19.98% of the shares.

View full answer

Is Dharmaj Crop overvalued or undervalued?

07-Oct-2025

As of October 6, 2025, Dharmaj Crop's stock is considered attractive and undervalued with a PE ratio of 20.32, lower than its peers, and despite a recent decline, it has delivered a strong year-to-date return of 21.75%.

As of 6 October 2025, the valuation grade for Dharmaj Crop has moved from fair to attractive, indicating a more favorable outlook for the company. The stock is currently considered undervalued, with a PE ratio of 20.32, an EV to EBITDA of 11.93, and a PEG ratio of 0.87, suggesting that the stock is trading at a reasonable price relative to its growth potential.<BR><BR>In comparison to its peers, Dharmaj Crop's PE ratio is significantly lower than UPL's 38.3 and P I Industries' 34.18, which are categorized as attractive and very expensive, respectively. Additionally, the company's ROCE stands at 11.64% and ROE at 13.28%, further supporting its valuation appeal. Notably, while the stock has experienced a YTD return of 21.75%, outperforming the Sensex's 4.67%, it has faced a decline of 14.92% over the past month, highlighting some volatility in the short term.

View full answer

How has been the historical performance of Dharmaj Crop?

01-Dec-2025

For the fiscal year ending March 2025, Dharmaj Crop reported a total operating income of 951.04 crore and a net profit after tax of 34.83 crore, with significant improvements in cash flow from operating activities to 38.00 crore. Total liabilities were 733.41 crore, including long-term borrowings of 64.11 crore.

Answer:<BR>The historical performance of Dharmaj Crop for the year ending March 2025 shows a total operating income of 951.04 crore, with a net profit after tax of 34.83 crore.<BR><BR>Breakdown:<BR>In the fiscal year ending March 2025, Dharmaj Crop reported total operating income of 951.04 crore, with raw material costs amounting to 595.83 crore and total expenditure (excluding depreciation) at 876.27 crore, leading to an operating profit (PBDIT) of 76.92 crore. After accounting for interest expenses of 12.90 crore and depreciation of 18.27 crore, the profit before tax stood at 45.76 crore, resulting in a profit after tax of 34.83 crore. The company maintained a shareholder's fund of 394.41 crore, with total liabilities reaching 733.41 crore, which included long-term borrowings of 64.11 crore. The cash flow from operating activities improved significantly to 38.00 crore, while the net cash outflow for the year was recorded at 2.00 crore, reflecting a closing cash and cash equivalent balance of 0.00 crore.

View full answer

Is Dharmaj Crop technically bullish or bearish?

02-Dec-2025

As of December 1, 2025, Dharmaj Crop's technical trend is neutral with mixed signals, showing a mildly bearish weekly MACD and bullish RSI, while daily moving averages are mildly bullish, indicating market uncertainty.

As of 1 December 2025, the technical trend for Dharmaj Crop has changed from mildly bearish to sideways. The current stance is neutral, with mixed signals across various indicators. The weekly MACD remains bearish, while the RSI is bullish, indicating some upward momentum. However, both the Bollinger Bands and the monthly MACD are mildly bearish, suggesting caution. The daily moving averages show a mildly bullish trend, but the KST and OBV indicate no clear trend on the weekly and monthly charts. Overall, the mixed signals reflect uncertainty in the market, leading to a neutral stance.

View full answer

Are Dharmaj Crop Guard Ltd latest results good or bad?

11-Feb-2026

Dharmaj Crop Guard Ltd's latest Q3 FY26 results are concerning, with a 95.61% QoQ drop in net profit to ₹0.76 crore and a 45.42% QoQ decline in revenue to ₹189.54 crore, indicating significant operational challenges and margin compression. Investors should be cautious due to the company's heavy reliance on non-operating income and declining profitability.

Dharmaj Crop Guard Ltd's latest results for Q3 FY26 indicate a challenging quarter for the company. The net profit has drastically decreased by 95.61% quarter-on-quarter (QoQ) to just ₹0.76 crore, which is also down 35.59% year-on-year (YoY). This significant drop raises concerns about the company's operational efficiency and profitability.<BR><BR>Revenue for the same quarter fell sharply by 45.42% QoQ to ₹189.54 crore, although it showed a modest increase of 8.61% YoY. The operating margin has also been severely impacted, declining to 3.87% from 9.16% in the previous quarter, highlighting issues with cost management and pricing power.<BR><BR>Moreover, the company has shown a heavy reliance on non-operating income, which accounted for a staggering 326.80% of profit before tax. This raises questions about the sustainability of its earnings quality.<BR><BR>Overall, the results reflect significant operational challenges and margin compression, leading to a negative outlook for the company. Investors should be cautious, as the recent performance suggests that the company is currently struggling to maintain profitability and operational stability.

View full answer

Should I buy, sell or hold Dharmaj Crop Guard Ltd?

12-Feb-2026

Why is Dharmaj Crop Guard Ltd falling/rising?

04-Apr-2026

As of 03-Apr, Dharmaj Crop Guard Ltd's stock price is rising to Rs 238.40, with a 1.12% increase and positive momentum despite a decline in investor participation. The stock has outperformed its sector and achieved consecutive gains, although it remains below several moving averages.

As of 03-Apr, Dharmaj Crop Guard Ltd's stock price is rising, currently at Rs 238.40, reflecting an increase of 2.65 (1.12%). This upward movement is supported by the stock outperforming its sector by 1.05% today and achieving a consecutive gain over the last two days, with a total return of 3.61% during this period. Additionally, the stock reached an intraday high of Rs 246.9, marking a rise of 4.73%. <BR><BR>Despite some indicators showing a decline in investor participation, with delivery volume falling by 41.14% against the 5-day average, the overall performance today indicates positive momentum. The stock's current price is higher than both the 5-day and 50-day moving averages, although it remains below the 20-day, 100-day, and 200-day moving averages. This suggests that while there are some mixed signals regarding liquidity and participation, the recent gains and positive performance relative to the sector contribute to the stock's rising price.

View full answer

Why is Dharmaj Crop Guard Ltd falling/rising?

05-Apr-2026

As of 04-Apr, Dharmaj Crop Guard Ltd's stock price is rising to Rs 238.40, reflecting a 1.12% increase. This rise is supported by strong fundamentals, including impressive profitability growth and a low Debt to EBITDA ratio, despite some negative sales indicators.

As of 04-Apr, Dharmaj Crop Guard Ltd's stock price is rising, currently at Rs 238.40, reflecting a change of Rs 2.65 or 1.12% increase. This upward movement can be attributed to several factors. The stock has outperformed its sector by 1.05% today and has shown a consecutive gain over the last two days, with a total return of 3.61% during this period. Additionally, the stock reached an intraday high of Rs 246.9, marking a 4.73% increase at its peak.<BR><BR>Despite some negative indicators, such as a significant drop in net sales and profit before tax compared to previous quarters, the company's strong fundamentals support its rising stock price. Dharmaj Crop Guard Ltd has a low Debt to EBITDA ratio of 1.54 times, indicating a strong ability to service its debt. Furthermore, the company has demonstrated impressive profitability growth, with a 42.4% increase in profits over the past year, contributing to a favorable PEG ratio of 0.4.<BR><BR>The stock's performance has been robust over the long term, with a 21.94% return over the past year and a notable outperformance against the BSE500 index over the last three years. Although there has been a decline in investor participation, as evidenced by a 41.14% drop in delivery volume, the overall market-beating performance and attractive valuation compared to peers suggest that the stock's rise is supported by its strong financial metrics and historical performance.

View full answer

Why is Dharmaj Crop Guard Ltd falling/rising?

06-Apr-2026

As of 05-Apr, Dharmaj Crop Guard Ltd's stock price is rising to Rs 238.40, reflecting a 1.12% increase. This rise is supported by strong financial metrics, recent gains, and positive market sentiment, despite a decline in delivery volume.

As of 05-Apr, Dharmaj Crop Guard Ltd's stock price is rising, currently at Rs 238.40, reflecting a change of 2.65 (1.12%) upward. This increase can be attributed to several factors. Firstly, the stock has been gaining for the last two days, with a total return of 3.61% during this period. Additionally, it outperformed its sector by 1.05% today, indicating positive market sentiment.<BR><BR>The stock also reached an intraday high of Rs 246.9, which is a 4.73% increase, showcasing strong intraday performance. Furthermore, despite a decline in delivery volume by 41.14% against the 5-day average, the stock remains liquid enough for trading, suggesting that there is still interest among investors.<BR><BR>From a financial perspective, Dharmaj Crop Guard Ltd has demonstrated a strong ability to service its debt, with a low Debt to EBITDA ratio of 1.54 times. The company has a very attractive valuation, indicated by a Return on Capital Employed (ROCE) of 15.2 and a PEG ratio of 0.4, which suggests that the stock is trading at a discount compared to its peers. Over the past year, the stock has generated a return of 21.94%, while its profits have risen by 42.4%, further supporting its upward price movement.<BR><BR>Overall, the combination of recent gains, strong financial metrics, and positive market performance contributes to the rising stock price of Dharmaj Crop Guard Ltd.

View full answer

Which are the latest news on Dharmaj Crop?

06-Apr-2026

iScoreScore
Click here to find our call on this stock
Strong Sell
Sell
Hold
Buy
Strong Buy

Dashboard

1

  • NET SALES(Q) At Rs 189.54 cr has Fallen at -31.0% (vs previous 4Q average)
  • PBT LESS OI(Q) At Rs -2.20 cr has Fallen at -114.1% (vs previous 4Q average)
  • PAT(Q) At Rs 0.76 cr has Fallen at -93.8% (vs previous 4Q average)
2

Despite the size of the company, domestic mutual funds hold only 0% of the company
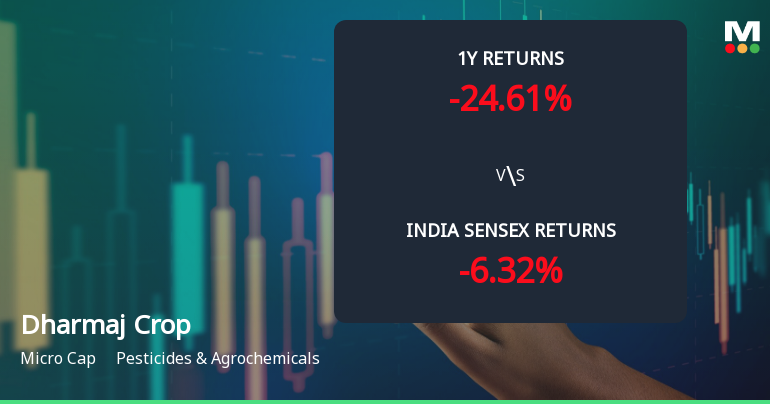
stock-summaryMojo Parameters

Mojo Parameters

Loading Valuation Snapshot...

Stock DNA

stock-summary
Industry

Pesticides & Agrochemicals

stock-summary
Market cap

INR 850 Cr (Micro Cap)

stock-summary
P/E

17.00

stock-summary
Industry P/E

28

stock-summary
Dividend Yield

0.00%

stock-summary
Debt Equity

0.28

stock-summary
Return on Equity

12.24%

stock-summary
Price to Book

2.04

Revenue and Profits:
Net Sales:
190 Cr
(Quarterly Results - Dec 2025)
Net Profit:
1 Cr
stock-summaryTotal Returns
Total Returns (Price + Dividend) stock-summary
Dividend Yield (0%)
TimePeriod
Price Return
Dividend Return
Total Return
3 Months
1.61%
0%
1.61%
6 Months
-22.42%
0%
-22.42%
1 Year
25.87%
0%
25.87%
2 Years
0.75%
0%
0.75%
3 Years
48.75%
0%
48.75%
4 Years
0%
0%
0.0%
5 Years
0%
0%
0.0%

Dharmaj Crop for the last several years.

Risk Adjusted Returns v/s stock-summary
Returns Beta
Icon
Beta has not been calculated since enough price history is not available
stock-summaryNews & Corporate Actions

Announcements stock-summary

Compliances-Certificate under Reg. 74 (5) of SEBI (DP) Regulations 2018

04-Apr-2026 | Source : BSE

Compliance Certificate with reference to the Captioned Subject is attached

Announcement under Regulation 30 (LODR)-Credit Rating

03-Apr-2026 | Source : BSE

Credit rating withdrawal

Closure of Trading Window

25-Mar-2026 | Source : BSE

The Trading window will remain close from April 012026 for the Quarter and Year ended Audited Financial Result for the Quarter and year ended on March 312026 till 48 hours from the the declaration of the audited result .

Corporate Actions stock-summary

stock-summary
BOARD MEETING

No Upcoming Board Meetings

stock-summary
DIVIDEND

No Dividend history available

stock-summary
SPLITS

No Splits history available

stock-summary
BONUS

No Bonus history available

stock-summary
RIGHTS

No Rights history available

stock-summaryKey Factors

Quality key factors stock-summary

Factor
Value
Sales Growth (5y)
25.69%
EBIT Growth (5y)
17.30%
EBIT to Interest (avg)
14.39
Debt to EBITDA (avg)
1.62
Net Debt to Equity (avg)
0.28
Sales to Capital Employed (avg)
1.55
Tax Ratio
24.70%
Dividend Payout Ratio
0
Pledged Shares
0
Institutional Holding
3.96%
ROCE (avg)
12.72%
ROE (avg)
11.64%

Valuation key factors

Factor
Value
P/E Ratio
17
Industry P/E
28
Price to Book Value
2.08
EV to EBIT
12.48
EV to EBITDA
9.96
EV to Capital Employed
1.84
EV to Sales
0.84
PEG Ratio
0.40
Dividend Yield
NA
ROCE (Latest)
15.23%
ROE (Latest)
12.24%

Technicals key factors

Indicator
Weekly
Monthly
MACD
Mildly Bullish
Mildly Bearish
RSI
No Signal
No Signal
Bollinger Bands
Sideways
Mildly Bearish
Moving Averages
Mildly Bearish (Daily)
KST
Mildly Bullish
Dow Theory
Mildly Bullish
No Trend
OBV
No Trend
No Trend
stock-summary Technical Indicator Scale: Bearish, Mildly Bearish, Sideways, Mildly Bullish, Bullish  Turned 
stock-summaryShareholding
Shareholding Snapshot : Dec 2025stock-summary
Shareholding Compare (%holding) stock-summary
Majority shareholders

Promoters

Pledged Promoter Holdings

None

Mutual Funds

Held by 0 Schemes

FIIs

Held by 7 FIIs (3.49%)

Promoter with highest holding

Talavia Rameshbhai Ravajibhai (26.67%)

Highest Public shareholder

Unico Global Opportunities Fund Limited (1.48%)

Individual Investors Holdings

20.33%

stock-summaryFinancial
[
  {
    "link": "quarterly",
    "btn_text": "All Quarterly Results",
    "header": "Quarterly Results Snapshot (Standalone) - Dec'25 - QoQ",
    "rhs": [
      {
        "prefix": "Net Sales ",
        "suffix": "QoQ Growth in quarter ended Dec 2025 is -45.42% vs -5.48% in Sep 2025",
        "dir": -1
      },
      {
        "prefix": "Standalone Net Profit ",
        "suffix": "QoQ Growth in quarter ended Dec 2025 is -95.56% vs -46.76% in Sep 2025",
        "dir": -1
      }
    ],
    "table": {
      "header": [
        "Dec'25",
        "Sep'25",
        "Change(%)"
      ],
      "body": [
        {
          "field": "Net Sales",
          "val1": "189.54",
          "val2": "347.26",
          "chgp": "-45.42%",
          "chgp_class": "negative"
        },
        {
          "field": "Operating Profit (PBDIT) excl Other Income",
          "val1": "7.33",
          "val2": "31.80",
          "chgp": "-76.95%",
          "chgp_class": "negative"
        },
        {
          "field": "Interest",
          "val1": "4.64",
          "val2": "4.50",
          "chgp": "3.11%",
          "chgp_class": "negative"
        },
        {
          "field": "Exceptional Items",
          "val1": "0.00",
          "val2": "0.00",
          "chgp": "",
          "chgp_class": "neutral"
        },
        {
          "field": "Standalone Net Profit",
          "val1": "0.77",
          "val2": "17.35",
          "chgp": "-95.56%",
          "chgp_class": "negative"
        },
        {
          "field": "Operating Profit Margin (Excl OI)",
          "val1": "3.87%",
          "val2": "9.16%",
          "chgp": "-5.29%",
          "chgp_class": "negative"
        }
      ]
    }
  },
  {
    "link": "half-yearly",
    "btn_text": "All Half Yearly Results",
    "header": "Half Yearly Results Snapshot (Standalone) - Sep'25",
    "rhs": [
      {
        "prefix": "Net Sales ",
        "suffix": " Growth in half year ended Sep 2025 is 26.13% vs 36.66% in Sep 2024",
        "dir": -1
      },
      {
        "prefix": "Standalone Net Profit ",
        "suffix": " Growth in half year ended Sep 2025 is 38.34% vs -3.81% in Sep 2024",
        "dir": 1
      }
    ],
    "table": {
      "header": [
        "Sep'25",
        "Sep'24",
        "Change(%)"
      ],
      "body": [
        {
          "field": "Net Sales",
          "val1": "714.65",
          "val2": "566.61",
          "chgp": "26.13%",
          "chgp_class": "positive"
        },
        {
          "field": "Operating Profit (PBDIT) excl Other Income",
          "val1": "82.53",
          "val2": "61.45",
          "chgp": "34.30%",
          "chgp_class": "positive"
        },
        {
          "field": "Interest",
          "val1": "7.62",
          "val2": "5.67",
          "chgp": "34.39%",
          "chgp_class": "negative"
        },
        {
          "field": "Exceptional Items",
          "val1": "0.00",
          "val2": "0.00",
          "chgp": "",
          "chgp_class": "neutral"
        },
        {
          "field": "Standalone Net Profit",
          "val1": "49.94",
          "val2": "36.10",
          "chgp": "38.34%",
          "chgp_class": "positive"
        },
        {
          "field": "Operating Profit Margin (Excl OI)",
          "val1": "11.55%",
          "val2": "10.85%",
          "chgp": "0.70%",
          "chgp_class": "positive"
        }
      ]
    }
  },
  {
    "link": "nine-monthly",
    "btn_text": "All Nine Monthly Results",
    "header": "Nine Monthly Results Snapshot (Standalone) - Dec'25",
    "rhs": [
      {
        "prefix": "Net Sales ",
        "suffix": "YoY Growth in nine months ended Dec 2025 is 22.00% vs 37.75% in Dec 2024",
        "dir": -1
      },
      {
        "prefix": "Standalone Net Profit ",
        "suffix": "YoY Growth in nine months ended Dec 2025 is 36.02% vs -17.63% in Dec 2024",
        "dir": 1
      }
    ],
    "table": {
      "header": [
        "Dec'25",
        "Dec'24",
        "Change(%)"
      ],
      "body": [
        {
          "field": "Net Sales",
          "val1": "904.19",
          "val2": "741.12",
          "chgp": "22.00%",
          "chgp_class": "positive"
        },
        {
          "field": "Operating Profit (PBDIT) excl Other Income",
          "val1": "89.86",
          "val2": "70.95",
          "chgp": "26.65%",
          "chgp_class": "positive"
        },
        {
          "field": "Interest",
          "val1": "12.26",
          "val2": "8.93",
          "chgp": "37.29%",
          "chgp_class": "negative"
        },
        {
          "field": "Exceptional Items",
          "val1": "0.00",
          "val2": "0.00",
          "chgp": "",
          "chgp_class": "neutral"
        },
        {
          "field": "Standalone Net Profit",
          "val1": "50.71",
          "val2": "37.28",
          "chgp": "36.02%",
          "chgp_class": "positive"
        },
        {
          "field": "Operating Profit Margin (Excl OI)",
          "val1": "9.94%",
          "val2": "9.57%",
          "chgp": "0.37%",
          "chgp_class": "positive"
        }
      ]
    }
  },
  {
    "link": "annual",
    "btn_text": "All Annual Results",
    "header": "Annual Results Snapshot (Standalone) - Mar'25",
    "rhs": [
      {
        "prefix": "Net Sales ",
        "suffix": "YoY Growth in year ended Mar 2025 is 45.40% vs 24.76% in Mar 2024",
        "dir": 1
      },
      {
        "prefix": "Standalone Net Profit ",
        "suffix": "YoY Growth in year ended Mar 2025 is -21.50% vs 65.23% in Mar 2024",
        "dir": -1
      }
    ],
    "table": {
      "header": [
        "Mar'25",
        "Mar'24",
        "Change(%)"
      ],
      "body": [
        {
          "field": "Net Sales",
          "val1": "951.04",
          "val2": "654.10",
          "chgp": "45.40%",
          "chgp_class": "positive"
        },
        {
          "field": "Operating Profit (PBDIT) excl Other Income",
          "val1": "74.78",
          "val2": "62.94",
          "chgp": "18.81%",
          "chgp_class": "positive"
        },
        {
          "field": "Interest",
          "val1": "12.90",
          "val2": "3.45",
          "chgp": "273.91%",
          "chgp_class": "negative"
        },
        {
          "field": "Exceptional Items",
          "val1": "0.00",
          "val2": "0.00",
          "chgp": "",
          "chgp_class": "neutral"
        },
        {
          "field": "Standalone Net Profit",
          "val1": "34.84",
          "val2": "44.38",
          "chgp": "-21.50%",
          "chgp_class": "negative"
        },
        {
          "field": "Operating Profit Margin (Excl OI)",
          "val1": "7.86%",
          "val2": "9.62%",
          "chgp": "-1.76%",
          "chgp_class": "negative"
        }
      ]
    }
  }
]

Quarterly Results Snapshot (Standalone) - Dec'25 - QoQstock-summary

Dec'25
Sep'25
Change(%)
Net Sales
189.54
347.26
-45.42%
Operating Profit (PBDIT) excl Other Income
7.33
31.80
-76.95%
Interest
4.64
4.50
3.11%
Exceptional Items
0.00
0.00
Standalone Net Profit
0.77
17.35
-95.56%
Operating Profit Margin (Excl OI)
3.87%
9.16%
-5.29%
Values in Rs Cr.
Direction Arrows
Net Sales

QoQ Growth in quarter ended Dec 2025 is -45.42% vs -5.48% in Sep 2025

Direction Arrows
Standalone Net Profit

QoQ Growth in quarter ended Dec 2025 is -95.56% vs -46.76% in Sep 2025

Half Yearly Results Snapshot (Standalone) - Sep'25stock-summary

Sep'25
Sep'24
Change(%)
Net Sales
714.65
566.61
26.13%
Operating Profit (PBDIT) excl Other Income
82.53
61.45
34.30%
Interest
7.62
5.67
34.39%
Exceptional Items
0.00
0.00
Standalone Net Profit
49.94
36.10
38.34%
Operating Profit Margin (Excl OI)
11.55%
10.85%
0.70%
Values in Rs Cr.
Direction Arrows
Net Sales

Growth in half year ended Sep 2025 is 26.13% vs 36.66% in Sep 2024

Direction Arrows
Standalone Net Profit

Growth in half year ended Sep 2025 is 38.34% vs -3.81% in Sep 2024

Nine Monthly Results Snapshot (Standalone) - Dec'25stock-summary

Dec'25
Dec'24
Change(%)
Net Sales
904.19
741.12
22.00%
Operating Profit (PBDIT) excl Other Income
89.86
70.95
26.65%
Interest
12.26
8.93
37.29%
Exceptional Items
0.00
0.00
Standalone Net Profit
50.71
37.28
36.02%
Operating Profit Margin (Excl OI)
9.94%
9.57%
0.37%
Values in Rs Cr.
Direction Arrows
Net Sales

YoY Growth in nine months ended Dec 2025 is 22.00% vs 37.75% in Dec 2024

Direction Arrows
Standalone Net Profit

YoY Growth in nine months ended Dec 2025 is 36.02% vs -17.63% in Dec 2024

Annual Results Snapshot (Standalone) - Mar'25stock-summary

Mar'25
Mar'24
Change(%)
Net Sales
951.04
654.10
45.40%
Operating Profit (PBDIT) excl Other Income
74.78
62.94
18.81%
Interest
12.90
3.45
273.91%
Exceptional Items
0.00
0.00
Standalone Net Profit
34.84
44.38
-21.50%
Operating Profit Margin (Excl OI)
7.86%
9.62%
-1.76%
Values in Rs Cr.
Direction Arrows
Net Sales

YoY Growth in year ended Mar 2025 is 45.40% vs 24.76% in Mar 2024

Direction Arrows
Standalone Net Profit

YoY Growth in year ended Mar 2025 is -21.50% vs 65.23% in Mar 2024

stock-summaryCompany CV
About Dharmaj Crop Guard Ltd stock-summary
stock-summary
Dharmaj Crop Guard Ltd
Micro Cap
Pesticides & Agrochemicals
Dharmaj Crop Guard Limited was incorporated as a Public Limited Company on January 19, 2015 under Companies Act, 2013 issued by the Registrar of Companies, Gujarat at Ahmedabad. The Company being an agrochemical company is presently engaged in business of manufacturing and dealing in pesticides including concessionaires of public health products for pest control, insecticides, herbicide, fertilizers and allied products related to research and technical formulations.
Company Coordinates stock-summary
Icon
No Company Details Available