
Compare Diffusion Eng with Similar Stocks
Dashboard
The company is Net-Debt Free
Poor long term growth as Net Sales has grown by an annual rate of 13.20% over the last 5 years
The company has declared Positive results for the last 3 consecutive quarters
With ROE of 12.6, it has a Expensive valuation with a 3.4 Price to Book Value
Increasing Participation by Institutional Investors
Market Beating Performance
Stock DNA
Other Industrial Products
INR 1,394 Cr (Micro Cap)
27.00
36
0.41%
-0.17
12.56%
3.37
Total Returns (Price + Dividend) 
Latest dividend: 1.5 per share ex-dividend date: Jul-10-2025
Risk Adjusted Returns v/s
Returns Beta

News

Diffusion Engineers Ltd Upgraded to Hold as Technicals and Financials Improve
Diffusion Engineers Ltd, a micro-cap player in the Other Industrial Products sector, has seen its investment rating upgraded from Sell to Hold as of 10 June 2026. This change reflects a combination of improved technical indicators, solid financial performance, and evolving valuation metrics, signalling a cautious but optimistic outlook for investors.
Read full news article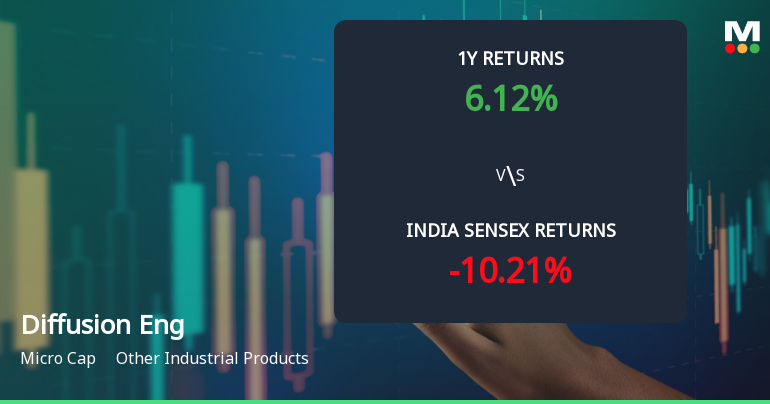
Diffusion Engineers Ltd Shows Technical Momentum Shift Amid Micro-Cap Resurgence
Diffusion Engineers Ltd, a micro-cap player in the Other Industrial Products sector, has experienced a notable shift in its technical momentum, signalling a transition from a sideways trend to a mildly bullish stance. This change is underscored by mixed signals from key technical indicators such as MACD, RSI, Bollinger Bands, and moving averages, reflecting a nuanced market sentiment as the stock price advances to ₹345.95, up 4.61% on 11 Jun 2026.
Read full news article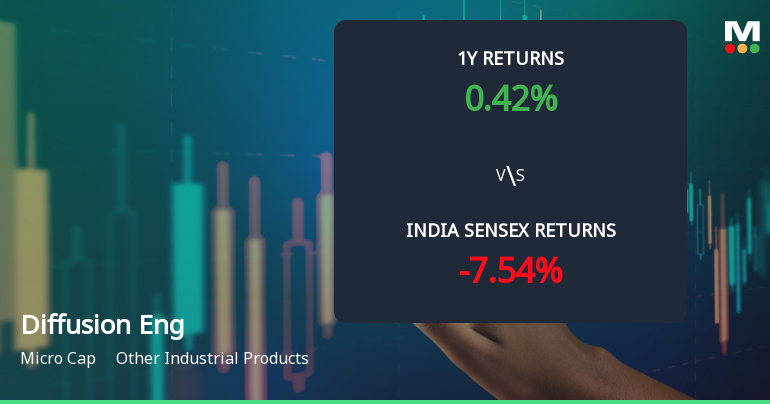
Diffusion Engineers Ltd Technical Momentum Shifts Amid Mixed Market Signals
Diffusion Engineers Ltd, a micro-cap player in the Other Industrial Products sector, has experienced a notable shift in its technical momentum, moving from a mildly bearish stance to a sideways trend. Despite a modest day decline of 0.20%, the stock’s technical indicators present a complex picture, with bullish signals on weekly MACD and KST counterbalanced by bearish RSI and mildly bearish daily moving averages. This nuanced technical landscape warrants a detailed analysis for investors seeking clarity on the stock’s near-term trajectory.
Read full news article Announcements
Pre- Intimation Of Investor/Analyst Meet On 15Th & 16Th June 2026.
10-Jun-2026 | Source : BSEPre- Intimation of Investor/ Analyst meet on 15th & 16th June 2026.
Post- Intimation Of Participation In Virtual Meeting With Geojit Financial Services On 22Nd May 2026
22-May-2026 | Source : BSEPost- Intimation of Participation in virtual meeting with Geojit Financial Services on 22nd May 2026
Announcement under Regulation 30 (LODR)-Earnings Call Transcript
22-May-2026 | Source : BSETranscript of the Analysts/ Institutional Investors meeting/ Call on Financial Results for the quarter and year ended March 31 2026
Corporate Actions

No Upcoming Board Meetings

Diffusion Engineers Ltd has declared 15% dividend, ex-date: 10 Jul 25

No Splits history available

No Bonus history available

No Rights history available
Quality key factors
Valuation key factors
Technicals key factors
 Technical Indicator Scale: Bearish, Mildly Bearish, Sideways, Mildly Bullish, Bullish Turned
 Shareholding Snapshot : Mar 2026
Shareholding Compare (%holding)
Promoters
None
Held by 1 Schemes (2.46%)
Held by 4 FIIs (0.41%)
Prashant Garg (27.91%)
Hdfc Mutual Fund - Hdfc Dividend Yield Fund (2.46%)
16.02%
Quarterly Results Snapshot (Consolidated) - Mar'26 - QoQ

QoQ Growth in quarter ended Mar 2026 is 40.42% vs 20.64% in Dec 2025
QoQ Growth in quarter ended Mar 2026 is 32.59% vs 19.52% in Dec 2025
Half Yearly Results Snapshot (Standalone) - Sep'25
Not Applicable: The company has declared_date for only one period
Not Applicable: The company has declared_date for only one period
Nine Monthly Results Snapshot (Standalone) - Dec'25
Not Applicable: The company has declared_date for only one period
Not Applicable: The company has declared_date for only one period
Annual Results Snapshot (Consolidated) - Mar'26
YoY Growth in year ended Mar 2026 is 21.28% vs 20.54% in Mar 2025
YoY Growth in year ended Mar 2026 is 40.13% vs 17.12% in Mar 2025
About Diffusion Engineers Ltd

Company Coordinates


