
Compare Digjam with Similar Stocks
Dashboard
With HIgh Debt (Debt-Equity Ratio at 13.37 times)- the company has a Weak Long Term Fundamental Strength
- Poor long term growth as Net Sales has grown by an annual rate of 40.54% over the last 5 years
- High Debt Company with a Debt to Equity ratio (avg) of 2.51 times
Consistent Underperformance against the benchmark over the last 3 years
Stock DNA
Garments & Apparels
INR 91 Cr (Micro Cap)
39.00
26
0.00%
13.37
52.71%
19.98
Total Returns (Price + Dividend) 
Digjam for the last several years.
Risk Adjusted Returns v/s
Returns Beta

News
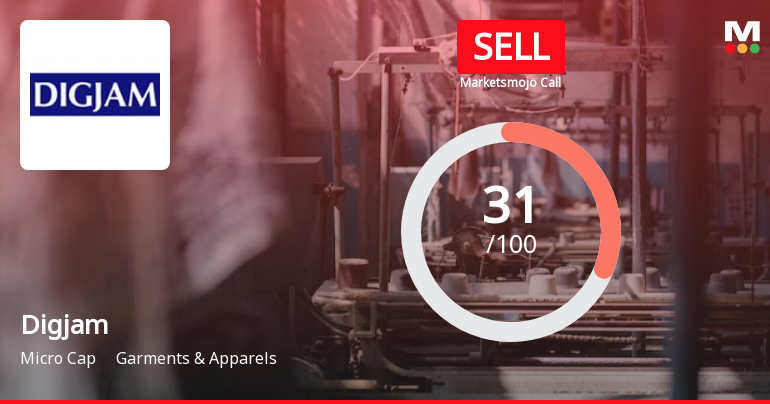
Digjam Ltd is Rated Sell by MarketsMOJO
Digjam Ltd is rated 'Sell' by MarketsMOJO, with this rating last updated on 11 May 2026. However, the analysis and financial metrics presented here reflect the stock's current position as of 20 July 2026, providing investors with an up-to-date view of the company’s fundamentals, returns, and technical outlook.
Read full news article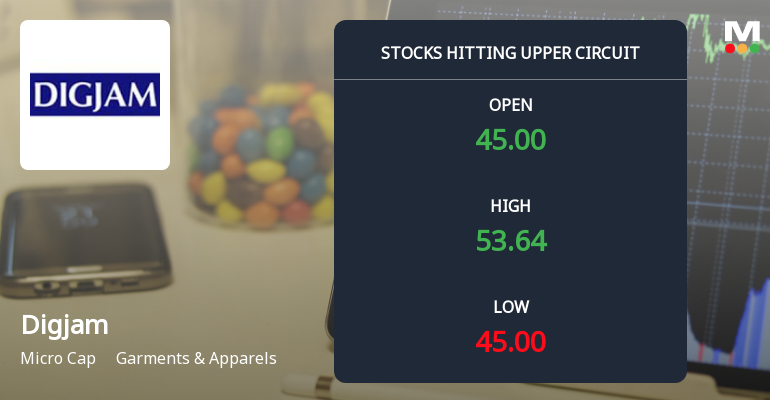
Digjam Ltd Locks at Upper Circuit With 14.34% Gain — Buyers Queue, Sellers Absent
At Rs 52.05, the buying was done — not because demand dried up, but because the exchange wouldn't let the stock go any higher. Digjam Ltd locked at its upper circuit of 14.34% on 14 Jul 2026, with buyers queuing and no sellers willing to part with shares.
Read full news article
Digjam Ltd is Rated Sell by MarketsMOJO
Digjam Ltd is rated 'Sell' by MarketsMOJO, with this rating last updated on 11 May 2026. However, the analysis and financial metrics discussed here reflect the stock’s current position as of 09 July 2026, providing investors with an up-to-date view of the company’s fundamentals, valuation, financial trends, and technical outlook.
Read full news article Announcements
Digjam Limited - Extension of Annual General Meeting
28-Nov-2019 | Source : NSEDigjam Limited has informed the Exchange regarding Extension of Annual General Meeting.
Digjam Limited - Other General Purpose
30-Oct-2019 | Source : NSEDigjam Limited has informed the Exchange about the Outcome of 5th CoC meeting
Digjam Limited - Other General Purpose
22-Oct-2019 | Source : NSEDigjam Limited has informed the Exchange about Invitation of Expression (Form G) dated October 18, 2019
Corporate Actions

No Upcoming Board Meetings

No Dividend history available

No Splits history available

No Bonus history available

No Rights history available
Quality key factors
Valuation key factors
Technicals key factors
 Technical Indicator Scale: Bearish, Mildly Bearish, Sideways, Mildly Bullish, Bullish Turned
 Shareholding Snapshot : Mar 2026
Shareholding Compare (%holding)
Promoters
None
Held by 2 Schemes (0.0%)
Held by 12 FIIs (1.79%)
Finquest Financial Solutions Pvt. Ltd. (75.0%)
Icici Bank Ltd (1.22%)
17.51%
Quarterly Results Snapshot (Standalone) - Mar'26 - YoY

YoY Growth in quarter ended Mar 2026 is 32.85% vs 108.08% in Mar 2025
YoY Growth in quarter ended Mar 2026 is -120.00% vs 248.98% in Mar 2025
Half Yearly Results Snapshot (Standalone) - Sep'25

Growth in half year ended Sep 2025 is 171.62% vs -52.97% in Sep 2024
Growth in half year ended Sep 2025 is 95.41% vs -116.58% in Sep 2024
Nine Monthly Results Snapshot (Standalone) - Dec'25
YoY Growth in nine months ended Dec 2025 is 108.74% vs -39.77% in Dec 2024
YoY Growth in nine months ended Dec 2025 is 98.25% vs -60.04% in Dec 2024
Annual Results Snapshot (Standalone) - Mar'26
YoY Growth in year ended Mar 2026 is 82.86% vs 619.37% in Mar 2025
YoY Growth in year ended Mar 2026 is 90.57% vs 12.11% in Mar 2025
About Digjam Ltd

Company Coordinates


