
Compare Diligent Media with Similar Stocks
Dashboard
With a Negative Book Value, the company has a Weak Long Term Fundamental Strength
- Poor long term growth as Net Sales has grown by an annual rate of 15.70% and Operating profit at 0% over the last 5 years
- The company has a negative book value of Rs 252.60 crore
Negative results in Mar 26
Risky - Negative EBITDA
Below par performance in long term as well as near term
Stock DNA
Media & Entertainment
INR 34 Cr (Micro Cap)
NA (Loss Making)
11
0.00%
-1.73
3.52%
-0.13
Total Returns (Price + Dividend) 
Diligent Media for the last several years.
Risk Adjusted Returns v/s
Returns Beta

News
Are Diligent Media Corporation Ltd latest results good or bad?
Diligent Media Corporation Ltd's latest financial results for Q4 FY26 reveal significant operational challenges. The company reported net sales of ₹1.62 crores, which reflects a substantial year-on-year decline of 71.38% compared to ₹5.66 crores in the same quarter last year. This decline indicates severe difficulties in revenue generation, exacerbated by a volatile sales pattern observed in previous quarters. The net profit for the quarter was reported at a loss of ₹6.02 crores, marking a dramatic year-on-year decline of 251.30% from a profit of ₹3.98 crores in Q4 FY25. This loss was largely influenced by an extraordinary tax charge that resulted in an effective tax rate of 1,500%, which significantly impacted profitability despite a modest pre-tax profit of ₹0.43 crores. Operating margins also reflected a concerning trend, with the operating profit margin (excluding other income) at 8.02%, down from 47....
Read full news article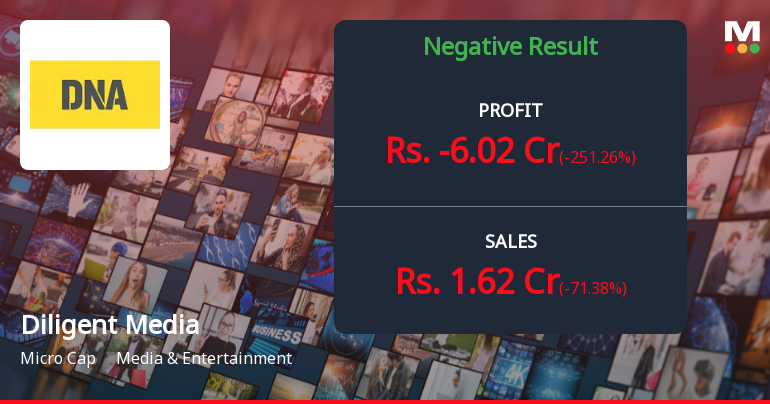
Diligent Media Q4 FY26: Steep Losses Erase Gains as Tax Anomaly Triggers ₹6 Crore Write-Off
Diligent Media Corporation Ltd., the media and entertainment company behind the DNA newspaper, reported a startling quarterly loss of ₹6.02 crores in Q4 FY26 (March 2026), a dramatic reversal from the ₹3.98 crore profit recorded in the same quarter last year. The loss was primarily driven by an extraordinary tax charge of ₹6.45 crores—representing an unprecedented 1,500% tax rate on pre-tax profits of just ₹0.43 crores. The stock, currently trading at ₹2.92 with a micro-cap market capitalisation of ₹35 crores, has plunged 43.85% over the past year, significantly underperforming both the Sensex and its media sector peers.
Read full news article
Diligent Media Corporation Ltd is Rated Strong Sell
Diligent Media Corporation Ltd is rated Strong Sell by MarketsMOJO, with this rating last updated on 03 Jun 2025. However, the analysis and financial metrics presented here reflect the company’s current position as of 27 May 2026, providing investors with an up-to-date view of its fundamentals, returns, and market standing.
Read full news article Announcements
Announcement under Regulation 30 (LODR)-Change in Management
05-Jun-2026 | Source : BSEResignation of Non-Executive Director of the Company
Announcement under Regulation 30 (LODR)-Newspaper Publication
29-May-2026 | Source : BSENewspaper advertisement regarding publication of Annual Audited Financial Results for the fourth quarter and Financial Year ended March 31 2026
Audited Financial Results For The Quarter And Financial Year Ended March 31 2026
28-May-2026 | Source : BSEAudited Financial Results for the quarter and financial year ended March 31 2026
Corporate Actions

No Upcoming Board Meetings

No Dividend history available

No Splits history available

No Bonus history available

No Rights history available
Quality key factors
Valuation key factors
Technicals key factors
 Technical Indicator Scale: Bearish, Mildly Bearish, Sideways, Mildly Bullish, Bullish Turned
 Shareholding Snapshot : Mar 2026
Shareholding Compare (%holding)
Promoters
12.0676
Held by 1 Schemes (0.0%)
Held by 11 FIIs (4.0%)
25 Fps Media Private Limited (32.22%)
Shruti Mohta (1.89%)
31.55%
Quarterly Results Snapshot (Standalone) - Mar'26 - YoY

YoY Growth in quarter ended Mar 2026 is -71.38% vs 77.99% in Mar 2025
YoY Growth in quarter ended Mar 2026 is -251.26% vs -96.83% in Mar 2025
Half Yearly Results Snapshot (Standalone) - Sep'25
Growth in half year ended Sep 2025 is -40.21% vs 50.00% in Sep 2024
Growth in half year ended Sep 2025 is -135.92% vs 24.56% in Sep 2024
Nine Monthly Results Snapshot (Standalone) - Dec'25
YoY Growth in nine months ended Dec 2025 is -35.06% vs 15.31% in Dec 2024
YoY Growth in nine months ended Dec 2025 is -129.56% vs -13.23% in Dec 2024
Annual Results Snapshot (Standalone) - Mar'26
YoY Growth in year ended Mar 2026 is -50.64% vs 35.98% in Mar 2025
YoY Growth in year ended Mar 2026 is -165.20% vs -90.05% in Mar 2025
About Diligent Media Corporation Ltd

Company Coordinates


