
Compare Disa India with Similar Stocks
Dashboard
Flat results in Mar 26
- PAT(Q) At Rs 13.18 cr has Fallen at -10.3% (vs previous 4Q average)
- DEBTORS TURNOVER RATIO(HY) Lowest at 5.97 times
- NET SALES(Q) Lowest at Rs 90.81 cr
With ROE of 18.4, it has a Expensive valuation with a 5.4 Price to Book Value
Below par performance in long term as well as near term
Stock DNA
Industrial Manufacturing
INR 1,658 Cr (Small Cap)
29.00
36
0.88%
-0.71
18.43%
5.39
Total Returns (Price + Dividend) 
Latest dividend: 100 per share ex-dividend date: Aug-07-2025
Risk Adjusted Returns v/s
Returns Beta

News
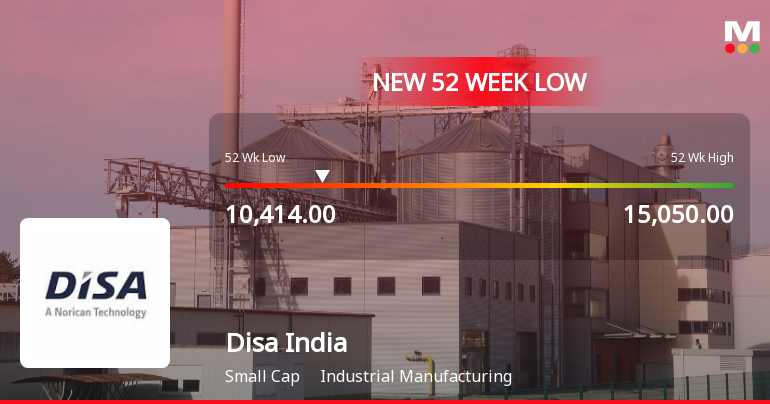
Disa India Ltd Falls to 52-Week Low of Rs 10,414 Amidst Mixed Financial Signals
A sharp decline in Disa India Ltd shares saw the stock hit a fresh 52-week low of Rs 10,414 on 12 Jun 2026, marking a significant 30.8% drop from its 52-week high of Rs 15,050. Despite a modest recovery over the past two sessions, the stock remains under pressure amid a complex interplay of valuation concerns and subdued quarterly performance.
Read full news article
Disa India Ltd is Rated Sell by MarketsMOJO
Disa India Ltd is rated Sell by MarketsMOJO, with this rating last updated on 20 May 2026. However, the analysis and financial metrics discussed here reflect the company’s current position as of 10 June 2026, providing investors with the latest insights into its performance and outlook.
Read full news article
Disa India Ltd Technical Momentum Shifts Amid Bearish Signals
Disa India Ltd, a small-cap player in the industrial manufacturing sector, has experienced a notable shift in its technical momentum, with key indicators signalling a bearish trend. Despite a strong long-term return profile, recent price action and technical parameters suggest caution for investors as the stock faces downward pressure.
Read full news article Announcements
Intimation Under Regulation 30 Of The SEBI (Listing Obligation And Disclosures Requirements) Regulations 2015 - Commencement Of Commercial Production At New Manufacturing Facility Situated At Tumkur.
31-May-2026 | Source : BSECommencement of Commercial Production at New Manufacturing Facility situated at Tumkur.
Compliances-Reg.24(A)-Annual Secretarial Compliance
27-May-2026 | Source : BSEAnnual Secretarial Compliance Report for the year ended March 31 2026
Announcement under Regulation 30 (LODR)-Newspaper Publication
20-May-2026 | Source : BSENewspaper Advertisement
Corporate Actions

No Upcoming Board Meetings

Disa India Ltd has declared 1000% dividend, ex-date: 07 Aug 25

No Splits history available

No Bonus history available

No Rights history available
Quality key factors
Valuation key factors
Technicals key factors
 Technical Indicator Scale: Bearish, Mildly Bearish, Sideways, Mildly Bullish, Bullish Turned
 Shareholding Snapshot : Mar 2026
Shareholding Compare (%holding)
Promoters
None
Held by 2 Schemes (8.23%)
Held by 3 FIIs (0.02%)
Disa Holdings Ag (54.1%)
Sbi Contra Fund (7.89%)
14.16%
Quarterly Results Snapshot (Consolidated) - Mar'26 - QoQ

QoQ Growth in quarter ended Mar 2026 is -29.40% vs 24.03% in Dec 2025
QoQ Growth in quarter ended Mar 2026 is -13.29% vs 24.59% in Dec 2025
Half Yearly Results Snapshot (Consolidated) - Sep'25

Growth in half year ended Sep 2025 is 12.59% vs 6.74% in Sep 2024
Growth in half year ended Sep 2025 is -8.82% vs 15.48% in Sep 2024
Nine Monthly Results Snapshot (Consolidated) - Dec'25
YoY Growth in nine months ended Dec 2025 is 18.54% vs 21.46% in Dec 2024
YoY Growth in nine months ended Dec 2025 is 7.27% vs 26.85% in Dec 2024
Annual Results Snapshot (Consolidated) - Mar'26
YoY Growth in year ended Mar 2026 is 8.91% vs 18.81% in Mar 2025
YoY Growth in year ended Mar 2026 is 6.35% vs 17.58% in Mar 2025
About Disa India Ltd

Company Coordinates


