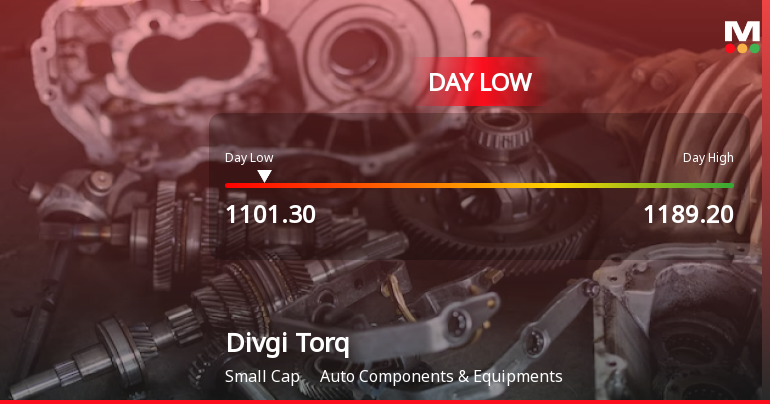
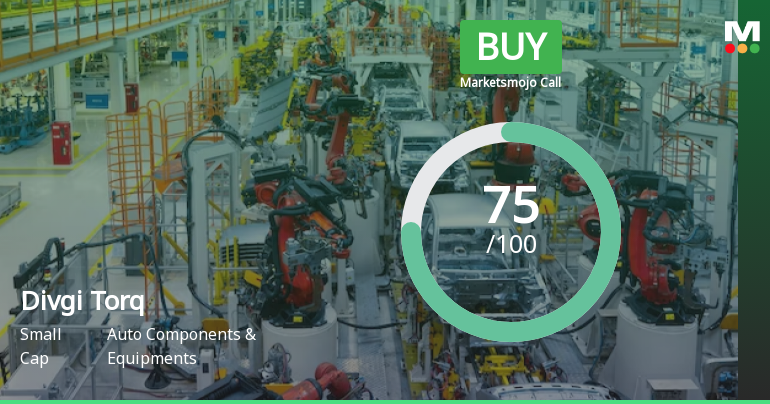
Divgi Torq

  • Market Cap: Small Cap
  • Industry: Auto Components & Equipments
  • ISIN: INE753U01022
  • NSEID: DIVGIITTS
  • BSEID: 543812
INR
1,101.10
-8.1 (-0.73%)
BSENSE

Sep 16, 11:00 AM

BSE+NSE Vol: 65.1 k

  • Price Points
  • Score
  • Mojo Parameters
  • Total Return
  • News and Corporate Actions
  • Key factors
  • Shareholding
  • Financials
  • CompanyCV
stock-summaryPrice Point
High/Low

1Day

52 Week

Valuation
Technical
Day's Volume

CASH

65.1 k (48.34%) Volume

Shareholding (Jun 2026)

FII

1.86%

Held by 16 FIIs

DII

26.16%

Held by 13 DIIs

Promoter

60.56%

Why is Divgi Torqtransfer Systems Ltd falling/rising?

06-Sep-2026

As of 05-Sep, Divgi Torqtransfer Systems Ltd's stock price is 1,234.40, down 0.41% and part of a three-day decline totaling 2.74%. Despite recent drops, the stock has performed well over longer periods, with a year-to-date increase of 104.12% and strong financial results, though concerns about valuation and long-term growth may be impacting investor sentiment.

As of 05-Sep, Divgi Torqtransfer Systems Ltd's stock price is currently at 1,234.40, reflecting a decrease of 5.1 points or 0.41%. This decline is part of a broader trend, as the stock has been losing value for the last three days, resulting in a total drop of 2.74% during this period. Additionally, the stock underperformed its sector by 0.3% today.<BR><BR>Despite these recent declines, the stock has shown strong performance over longer periods. For instance, it has increased by 4.89% over the past week and an impressive 29.03% over the last month. Year-to-date, the stock has surged by 104.12%, significantly outperforming the Sensex, which has decreased by 10.21% during the same timeframe. Furthermore, the stock has generated an 81.17% return over the past year, again surpassing the market's performance.<BR><BR>The company has reported outstanding financial results, including a 63.05% growth in net profit and a 55.4% increase in net sales compared to the previous four-quarter average. These positive results have contributed to high institutional holdings at 28.02%, indicating strong investor confidence.<BR><BR>However, the stock's recent price drop can be attributed to its consecutive falls and the current market conditions, which may be affecting investor sentiment. While the company is net-debt free and has shown remarkable growth in profits, concerns about its long-term growth potential and high valuation metrics, such as a price-to-book value of 5.9, may be contributing to the recent price decline.

View full answer

Who are in the management team of Divgi Torq?

01-Sep-2026

The management team of Divgi Torq includes Praveen P Kadle (Chairperson), Jitendra B Divgi (Managing Director), Hireendra Bhaskar Divgi (Whole-time Director), and several independent and non-executive directors, along with Sanika Surendra Nirgude as Company Secretary & Compliance Officer. This team is responsible for guiding the company's operations and ensuring compliance.

The management team of Divgi Torq includes the following key members:<BR><BR>1. **Praveen P Kadle** - Chairperson<BR>2. **Jitendra B Divgi** - Managing Director<BR>3. **Hireendra Bhaskar Divgi** - Whole-time Director<BR>4. **Pradip Dubhashi** - Independent Director<BR>5. **Pundalik Dinkar Kudva** - Independent Director<BR>6. **Geeta Prafullachandra Tolia** - Independent Director<BR>7. **Sanjay Bhalchandra Divgi** - Non-Executive Director<BR>8. **Bharat Bhalchandra Divgi** - Non-Executive Director<BR>9. **Ajay Limaye** - Non-Executive Director<BR>10. **Sanika Surendra Nirgude** - Company Secretary & Compliance Officer<BR><BR>This team plays a crucial role in guiding the company and ensuring its compliance and governance. If you have any more questions about Divgi Torq or its operations, feel free to ask!

View full answer

What does Divgi Torq do?

01-Sep-2026

Divgi Torqtransfer Systems Ltd is a small-cap company in the auto components industry, reporting net sales of ₹137 Cr and a net profit of ₹25 Cr for June 2026. It was established in 1964 and became a public company in March 2022.

Overview:<BR>Divgi Torqtransfer Systems Ltd operates in the auto components and equipment industry and is categorized as a small-cap company.<BR><BR>History:<BR>The company was originally incorporated as Divgi Metalwares Private Limited in 1964 and later changed its name to Divgi Torqtransfer Systems Limited upon becoming a public limited company in March 2022. The latest quarterly results reported net sales and profit for June 2026.<BR><BR>Financial Snapshot:<BR>Net Sales: 137 Cr (Quarterly Results - Jun 2026)<BR>Net Profit: 25 Cr (Quarterly Results - Jun 2026)<BR>Market Cap: INR 3,570 Cr (Small Cap)<BR><BR>Key Metrics:<BR>P/E: 57.00<BR>Industry P/E: 41<BR>Dividend Yield: 0.22%<BR>Debt Equity: -0.47<BR>Return on Equity: 10.40%<BR>Price to Book: 5.90<BR><BR>Contact Details:<BR>No Company Details Available<BR>Registrar Address: Not available.

View full answer

Who are the peers of the Divgi Torq?

01-Sep-2026

Divgi Torq's peers include Steel Str. Wheel, NRB Bearings, Uniparts India, Sandhar Tech, Wheels India, JTEKT India, Federal-Mogul Go, Carraro India, and Rane (Madras). In terms of performance, Uniparts India leads with a 1-year return of 126.09%, while Divgi Torq has an 82.27% return, and JTEKT India shows the lowest return at -8.18%.

Peers: The peers of Divgi Torq are Steel Str. Wheel, NRB Bearings, Uniparts India, Sandhar Tech, Wheels India, JTEKT India, Federal-Mogul Go, Carraro India, and Rane (Madras).<BR><BR>Quality Snapshot: Excellent management risk is observed at Steel Str. Wheel, NRB Bearings, Wheels India, JTEKT India, and Carraro India, while Average management risk is found at Uniparts India, Sandhar Tech, Divgi Torq, Federal-Mogul Go, Rane (Madras), and MM Forgings. Good growth is seen at Wheels India and Carraro India, while Average growth is noted at Sandhar Tech, Divgi Torq, and the rest. Below Average growth is present at Steel Str. Wheel, NRB Bearings, Uniparts India, JTEKT India, Federal-Mogul Go, and Rane (Madras). Excellent capital structure is held by NRB Bearings, Uniparts India, JTEKT India, Federal-Mogul Go, and Divgi Torq, while Average capital structure is seen at Steel Str. Wheel, Sandhar Tech, and MM Forgings, and Below Average capital structure is noted at Wheels India and Rane (Madras).<BR><BR>Return Snapshot: The peer with the highest 1-year return is Uniparts India at 126.09%, while the lowest is JTEKT India at -8.18%. Divgi Torq's 1-year return of 82.27% is significantly higher than JTEKT India's but lower than Uniparts India's. Additionally, JTEKT India is the only peer with a negative six-month return.

View full answer

How big is Divgi Torq?

01-Sep-2026

As of 31st August, Divgi Torqtransfer Systems Ltd has a market capitalization of 3,570.00 Cr, with recent Net Sales of 418.35 Cr and a Net Profit of 63.24 Cr.

As of 31st August, Divgi Torqtransfer Systems Ltd has a market capitalization of 3,570.00 Cr, categorizing it as a Small Cap company.<BR><BR>In the latest 4 quarters, the company reported Net Sales of 418.35 Cr and a Net Profit of 63.24 Cr.<BR><BR>The latest annual period for the balance sheet is March 2026, with Shareholder's Funds amounting to 635.46 Cr and Total Assets of 731.42 Cr.

View full answer

Should I buy, sell or hold Divgi Torqtransfer Systems Ltd?

13-Aug-2026

When is the next results date for Divgi Torqtransfer Systems Ltd?

07-Aug-2026

The next results date for Divgi Torqtransfer Systems Ltd is 11 August 2026.

The next results date for Divgi Torqtransfer Systems Ltd is scheduled for 11 August 2026.

View full answer

Are Divgi Torqtransfer Systems Ltd latest results good or bad?

26-May-2026

Divgi Torqtransfer Systems Ltd's latest Q4 FY26 results are strong, with a 31.50% increase in net profit and record revenue growth of 18.76%. However, concerns about long-term profitability and low return on equity suggest a cautious outlook for investors.

Divgi Torqtransfer Systems Ltd's latest results for Q4 FY26 can be considered quite strong. The company reported a net profit of ₹15.48 crores, which reflects a significant increase of 31.50% compared to the previous quarter. Additionally, revenue grew by 18.76% to reach an all-time high of ₹107.62 crores, marking the fourth consecutive quarter of sequential growth.<BR><BR>The operating margin also improved to 20.14%, the highest it has been in seven quarters, indicating enhanced operational efficiency. Furthermore, the profit after tax (PAT) margin expanded to 14.38%, up from 12.99% in the prior quarter, showcasing better cost management.<BR><BR>However, while these quarterly results are impressive, there are underlying concerns regarding the company's long-term profitability. Over the past five years, Divgi Torqtransfer has experienced a decline in operating profit at an annual rate of 20.42%, and its return on equity remains low at 6.05%. This raises questions about the sustainability of its growth and the effectiveness of capital allocation.<BR><BR>In summary, while the latest quarterly results are strong and indicate positive momentum, the long-term profitability challenges and valuation concerns suggest a cautious outlook for potential investors.

View full answer

Is Divgi Torq technically bullish or bearish?

05-Dec-2025

As of December 4, 2025, Divgi Torq's technical trend is neutral with mixed signals, showing a recent price increase to 611.00 but overall weak market sentiment and negative long-term returns compared to the Sensex.

As of 4 December 2025, the technical trend has changed from mildly bearish to sideways. The current technical stance for Divgi Torq is neutral, with mixed signals across different time frames. The weekly MACD and Dow Theory indicate mildly bearish conditions, while the daily moving averages show a mildly bullish trend. The KST is bullish on a weekly basis, but the overall sentiment remains tempered by the lack of clear signals from the RSI and Bollinger Bands. The stock has shown a recent price increase, closing at 611.00, up from the previous close of 585.75, but the longer-term returns are negative compared to the Sensex. Overall, the strength of the current stance is weak, reflecting uncertainty in the market.

View full answer

How has been the historical performance of Divgi Torq?

24-Nov-2025

Divgi Torq has shown a declining trend in key financial metrics over the past five years, with net sales and profits decreasing significantly, while total assets and liabilities have increased. Despite a slight improvement in cash flow from operating activities, the overall performance indicates reduced profitability and sales.

Answer:<BR>The historical performance of Divgi Torq shows a fluctuating trend in key financial metrics over the past five years.<BR><BR>Breakdown:<BR>Divgi Torq's net sales have decreased from 271.04 Cr in Mar'23 to 218.92 Cr in Mar'25, indicating a downward trend. Total operating income followed a similar pattern, declining from 271.04 Cr in Mar'23 to 218.92 Cr in Mar'25. The total expenditure, excluding depreciation, also decreased from 196.56 Cr in Mar'23 to 181.56 Cr in Mar'25. Operating profit (PBDIT) saw a decline from 82.10 Cr in Mar'23 to 58.57 Cr in Mar'25, while profit before tax decreased from 68.83 Cr in Mar'23 to 33.00 Cr in Mar'25. Consequently, profit after tax fell from 51.16 Cr in Mar'23 to 24.39 Cr in Mar'25. The earnings per share (EPS) decreased from 16.73 in Mar'23 to 7.98 in Mar'25. On the balance sheet, total assets increased from 642.00 Cr in Mar'23 to 660.45 Cr in Mar'25, while total liabilities rose from 642.00 Cr to 660.45 Cr in the same period. Cash flow from operating activities improved slightly from 40.00 Cr in Mar'23 to 35.00 Cr in Mar'25, but the net cash outflow was recorded at -16.00 Cr in Mar'25, compared to a net inflow of 26.00 Cr in Mar'24. Overall, Divgi Torq has experienced a decline in profitability and sales, while its asset and liability levels have increased.

View full answer

Is Divgi Torq overvalued or undervalued?

13-Nov-2025

As of November 12, 2025, Divgi Torq is considered very expensive and overvalued with a PE ratio of 71.35 and low returns on capital, significantly lagging behind its peers and the Sensex.

As of 12 November 2025, the valuation grade for Divgi Torq has moved from expensive to very expensive. The company is currently assessed as overvalued, with a PE ratio of 71.35, an EV to EBITDA of 39.17, and a Price to Book Value of 3.27. These ratios indicate a significant premium compared to its peers, such as Samvardh. Mothe. with a PE of 32.72 and an EV to EBITDA of 11.98, and Bosch, which has a PE of 48.27 and an EV to EBITDA of 43.48.<BR><BR>The company's financial metrics highlight a concerning valuation, especially given its low ROCE of 3.88% and ROE of 4.58%. While Divgi Torq has shown a stock return of 3.29% over the past week compared to the Sensex's 1.21%, its year-to-date return of 4.48% lags behind the Sensex's 8.10%. This underperformance, coupled with its very expensive valuation grade, reinforces the conclusion that Divgi Torq is overvalued in the current market environment.

View full answer

Who are the top shareholders of the Divgi Torq?

17-Jul-2025

The top shareholders of Divgi Torq include Divgi Holding Private Limited at 51.68%, Oman India Joint Investment Fund II at 12.19%, and mutual funds with a combined 12.74%. Individual investors own 7.78%, while foreign institutional investors hold 1.75%, with promoter pledging at a minimal 0.0003%.

The top shareholders of Divgi Torq include the promoters, with Divgi Holding Private Limited being the largest shareholder at 51.68%. Other significant shareholders are the Oman India Joint Investment Fund II, which holds 12.19%, and mutual funds, which collectively hold 12.74% across three schemes. Additionally, individual investors own 7.78% of the company, while foreign institutional investors (FIIs) hold 1.75% through five different entities. The promoter holdings are notably low in terms of pledging, at just 0.0003%.

View full answer

Has Divgi Torq declared dividend?

06-Jun-2025

Divgi Torqtransfer Systems Ltd has declared a 52% dividend, amounting to ₹2.6 per share, with an ex-date of July 22, 2024. Despite the dividend announcement, the company has experienced significant price declines, resulting in negative total returns over various periods.

Divgi Torqtransfer Systems Ltd has declared a 52% dividend.<BR><BR>Dividend Details:<BR>- Percentage announced: 52%<BR>- Amount per share: 2.6<BR>- Ex-date: Jul-22-2024<BR><BR>Dividend Yield: 0.45%.<BR><BR>Total Returns by Period:<BR>In the last 6 months, the price return was -11.61%, the dividend return was 0%, resulting in a total return of -11.61%.<BR><BR>Over the past year, the price return was -13.4%, the dividend return was 0.37%, leading to a total return of -13.03%.<BR><BR>In the 2-year period, the price return was -26.01%, the dividend return was 0.72%, culminating in a total return of -25.29%.<BR><BR>For the 3-year period, there was no price return, no dividend return, and thus a total return of 0.0%.<BR><BR>In the 4-year period, the price return remained at 0%, with no dividend return, resulting in a total return of 0.0%.<BR><BR>Finally, in the 5-year period, there was again no price return, no dividend return, leading to a total return of 0.0%.<BR><BR>Overall, while Divgi Torq has declared a dividend, the total returns over various periods reflect significant declines in price, indicating a challenging performance despite the dividend announcement.

View full answer
iScoreScore
Click here to find our call on this stock
Strong Sell
Sell
Hold
Buy
Strong Buy

Dashboard

1

The company is Net-Debt Free

 
2

With a growth in Net Profit of 63.05%, the company declared Outstanding results in Jun 26

3

High Institutional Holdings at 28.02%

4

Market Beating Performance

stock-summaryMojo Parameters

Mojo Parameters

Loading Valuation Snapshot...

Stock DNA

stock-summary
Industry

Auto Components & Equipments

stock-summary
Market cap

INR 3,257 Cr (Small Cap)

stock-summary
P/E

54.00

stock-summary
Industry P/E

NA

stock-summary
Dividend Yield

0.29%

stock-summary
Debt Equity

-0.46

stock-summary
Return on Equity

9.95%

stock-summary
Price to Book

5.33

Revenue and Profits:
Net Sales:
137 Cr
(Quarterly Results - Jun 2026)
Net Profit:
25 Cr
stock-summaryTotal Returns
Total Returns (Price + Dividend) stock-summary
Dividend Yield (0.29%)
TimePeriod
Price Return
Dividend Return
Total Return
3 Months
27.8%
0.38%
28.18%
6 Months
64.93%
0.46%
65.39%
1 Year
66.02%
0.49%
66.51%
2 Years
82.38%
1.00%
83.38%
3 Years
14.92%
0.82%
15.74%
4 Years
0%
0%
0.0%
5 Years
0%
0%
0.0%

Latest dividend: 3.2527827724976452 per share ex-dividend date: Sep-10-2026

Risk Adjusted Returns v/s stock-summary
Returns Beta
Icon
Beta has not been calculated since enough price history is not available
stock-summaryNews & Corporate Actions

News

Announcements stock-summary

Attached Herewith Is The Intimation Of Appointment Of Internal Auditors Of The Company.

09-Sep-2026 | Source : BSE

Attached herewith is the intimation of appointment of Internal Auditors of the Company

Announcement under Regulation 30 (LODR)-Resignation of Company Secretary / Compliance Officer

09-Sep-2026 | Source : BSE

Attached herewith is the Announcement under Regulation 30 regarding the Resignation of Company Secretary and Compliance officer of the Company.

Attached Herewith Is The Intimation Of Cancellation Of Analyst/Investor Meet Which Was Scheduled On September 08 2026.

09-Sep-2026 | Source : BSE

Attached herewith is the intimation of cancellation of Analyst/Investor meet which was scheduled on September 08 2026.

Corporate Actions stock-summary

stock-summary
BOARD MEETING

No Upcoming Board Meetings

stock-summary
DIVIDEND

Divgi Torqtransfer Systems Ltd has declared 65% dividend, ex-date: 10 Sep 26

stock-summary
SPLITS

No Splits history available

stock-summary
BONUS

No Bonus history available

stock-summary
RIGHTS

No Rights history available

stock-summaryKey Factors

Quality key factors stock-summary

Factor
Value
Sales Growth (5y)
16.58%
EBIT Growth (5y)
4.45%
EBIT to Interest (avg)
40.66
Debt to EBITDA (avg)
Net Debt is too low
Net Debt to Equity (avg)
-0.46
Sales to Capital Employed (avg)
0.40
Tax Ratio
25.10%
Dividend Payout Ratio
32.60%
Pledged Shares
0
Institutional Holding
28.02%
ROCE (avg)
11.02%
ROE (avg)
6.90%

Valuation key factors

Factor
Value
P/E Ratio
54
Industry P/E
0
Price to Book Value
5.33
EV to EBIT
49.17
EV to EBITDA
33.25
EV to Capital Employed
9.07
EV to Sales
7.40
PEG Ratio
0.41
Dividend Yield
0.29%
ROCE (Latest)
5.96%
ROE (Latest)
9.95%

Technicals key factors

Indicator
Weekly
Monthly
MACD
Bullish
Bullish
RSI
No Signal
No Signal
Bollinger Bands
Mildly Bullish
Mildly Bullish
Moving Averages
Bullish (Daily)
KST
Bullish
Dow Theory
Mildly Bearish
Bullish
OBV
No Trend
Bullish
stock-summary Technical Indicator Scale: Bearish, Mildly Bearish, Sideways, Mildly Bullish, Bullish  Turned 
stock-summaryShareholding
Shareholding Snapshot : Jun 2026stock-summary
Shareholding Compare (%holding) stock-summary
Majority shareholders

Promoters

Pledged Promoter Holdings

None

Mutual Funds

Held by 4 Schemes (12.44%)

FIIs

Held by 16 FIIs (1.86%)

Promoter with highest holding

Divgi Holding Pvt Ltd (51.68%)

Highest Public shareholder

Oman India Joint Investment Fund Ii (12.19%)

Individual Investors Holdings

7.66%

stock-summaryFinancial
[
  {
    "link": "quarterly",
    "btn_text": "All Quarterly Results",
    "header": "Quarterly Results Snapshot (Standalone) - Jun'26 - QoQ",
    "rhs": [
      {
        "prefix": "Net Sales ",
        "suffix": "QoQ Growth in quarter ended Jun 2026 is 27.43% vs 18.76% in Mar 2026",
        "dir": 1
      },
      {
        "prefix": "Standalone Net Profit ",
        "suffix": "QoQ Growth in quarter ended Jun 2026 is 63.05% vs 31.52% in Mar 2026",
        "dir": 1
      }
    ],
    "table": {
      "header": [
        "Jun'26",
        "Mar'26",
        "Change(%)"
      ],
      "body": [
        {
          "field": "Net Sales",
          "val1": "137.14",
          "val2": "107.62",
          "chgp": "27.43%",
          "chgp_class": "positive"
        },
        {
          "field": "Operating Profit (PBDIT) excl Other Income",
          "val1": "37.02",
          "val2": "21.67",
          "chgp": "70.84%",
          "chgp_class": "positive"
        },
        {
          "field": "Interest",
          "val1": "0.07",
          "val2": "0.08",
          "chgp": "-12.50%",
          "chgp_class": "positive"
        },
        {
          "field": "Exceptional Items",
          "val1": "0.00",
          "val2": "0.00",
          "chgp": "",
          "chgp_class": "neutral"
        },
        {
          "field": "Standalone Net Profit",
          "val1": "25.24",
          "val2": "15.48",
          "chgp": "63.05%",
          "chgp_class": "positive"
        },
        {
          "field": "Operating Profit Margin (Excl OI)",
          "val1": "26.99%",
          "val2": "20.14%",
          "chgp": "6.85%",
          "chgp_class": "positive"
        }
      ]
    }
  },
  {
    "link": "half-yearly",
    "btn_text": "All Half Yearly Results",
    "header": "Half Yearly Results Snapshot (Standalone) - Sep'25",
    "rhs": [
      {
        "prefix": "Net Sales ",
        "suffix": " Growth in half year ended Sep 2025 is 42.94% vs -13.66% in Sep 2024",
        "dir": 1
      },
      {
        "prefix": "Standalone Net Profit ",
        "suffix": " Growth in half year ended Sep 2025 is 42.61% vs -34.78% in Sep 2024",
        "dir": 1
      }
    ],
    "table": {
      "header": [
        "Sep'25",
        "Sep'24",
        "Change(%)"
      ],
      "body": [
        {
          "field": "Net Sales",
          "val1": "154.65",
          "val2": "108.19",
          "chgp": "42.94%",
          "chgp_class": "positive"
        },
        {
          "field": "Operating Profit (PBDIT) excl Other Income",
          "val1": "30.63",
          "val2": "20.09",
          "chgp": "52.46%",
          "chgp_class": "positive"
        },
        {
          "field": "Interest",
          "val1": "0.14",
          "val2": "0.15",
          "chgp": "-6.67%",
          "chgp_class": "positive"
        },
        {
          "field": "Exceptional Items",
          "val1": "0.00",
          "val2": "0.00",
          "chgp": "",
          "chgp_class": "neutral"
        },
        {
          "field": "Standalone Net Profit",
          "val1": "19.68",
          "val2": "13.80",
          "chgp": "42.61%",
          "chgp_class": "positive"
        },
        {
          "field": "Operating Profit Margin (Excl OI)",
          "val1": "19.81%",
          "val2": "18.57%",
          "chgp": "1.24%",
          "chgp_class": "positive"
        }
      ]
    }
  },
  {
    "link": "nine-monthly",
    "btn_text": "All Nine Monthly Results",
    "header": "Nine Monthly Results Snapshot (Standalone) - Dec'25",
    "rhs": [
      {
        "prefix": "Net Sales ",
        "suffix": "YoY Growth in nine months ended Dec 2025 is 52.63% vs -14.68% in Dec 2024",
        "dir": 1
      },
      {
        "prefix": "Standalone Net Profit ",
        "suffix": "YoY Growth in nine months ended Dec 2025 is 65.18% vs -37.64% in Dec 2024",
        "dir": 1
      }
    ],
    "table": {
      "header": [
        "Dec'25",
        "Dec'24",
        "Change(%)"
      ],
      "body": [
        {
          "field": "Net Sales",
          "val1": "245.27",
          "val2": "160.70",
          "chgp": "52.63%",
          "chgp_class": "positive"
        },
        {
          "field": "Operating Profit (PBDIT) excl Other Income",
          "val1": "48.35",
          "val2": "28.70",
          "chgp": "68.47%",
          "chgp_class": "positive"
        },
        {
          "field": "Interest",
          "val1": "0.22",
          "val2": "0.26",
          "chgp": "-15.38%",
          "chgp_class": "positive"
        },
        {
          "field": "Exceptional Items",
          "val1": "0.00",
          "val2": "0.00",
          "chgp": "",
          "chgp_class": "neutral"
        },
        {
          "field": "Standalone Net Profit",
          "val1": "31.45",
          "val2": "19.04",
          "chgp": "65.18%",
          "chgp_class": "positive"
        },
        {
          "field": "Operating Profit Margin (Excl OI)",
          "val1": "19.71%",
          "val2": "17.86%",
          "chgp": "1.85%",
          "chgp_class": "positive"
        }
      ]
    }
  },
  {
    "link": "annual",
    "btn_text": "All Annual Results",
    "header": "Annual Results Snapshot (Standalone) - Mar'26",
    "rhs": [
      {
        "prefix": "Net Sales ",
        "suffix": "YoY Growth in year ended Mar 2026 is 61.20% vs -13.61% in Mar 2025",
        "dir": 1
      },
      {
        "prefix": "Standalone Net Profit ",
        "suffix": "YoY Growth in year ended Mar 2026 is 92.41% vs -38.63% in Mar 2025",
        "dir": 1
      }
    ],
    "table": {
      "header": [
        "Mar'26",
        "Mar'25",
        "Change(%)"
      ],
      "body": [
        {
          "field": "Net Sales",
          "val1": "352.89",
          "val2": "218.92",
          "chgp": "61.20%",
          "chgp_class": "positive"
        },
        {
          "field": "Operating Profit (PBDIT) excl Other Income",
          "val1": "70.02",
          "val2": "37.36",
          "chgp": "87.42%",
          "chgp_class": "positive"
        },
        {
          "field": "Interest",
          "val1": "0.31",
          "val2": "0.38",
          "chgp": "-18.42%",
          "chgp_class": "positive"
        },
        {
          "field": "Exceptional Items",
          "val1": "0.00",
          "val2": "0.00",
          "chgp": "",
          "chgp_class": "neutral"
        },
        {
          "field": "Standalone Net Profit",
          "val1": "46.93",
          "val2": "24.39",
          "chgp": "92.41%",
          "chgp_class": "positive"
        },
        {
          "field": "Operating Profit Margin (Excl OI)",
          "val1": "19.84%",
          "val2": "17.07%",
          "chgp": "2.77%",
          "chgp_class": "positive"
        }
      ]
    }
  }
]

Quarterly Results Snapshot (Standalone) - Jun'26 - QoQstock-summary

Jun'26
Mar'26
Change(%)
Net Sales
137.14
107.62
27.43%
Operating Profit (PBDIT) excl Other Income
37.02
21.67
70.84%
Interest
0.07
0.08
-12.50%
Exceptional Items
0.00
0.00
Standalone Net Profit
25.24
15.48
63.05%
Operating Profit Margin (Excl OI)
26.99%
20.14%
6.85%
Values in Rs Cr.
Direction Arrows
Net Sales

QoQ Growth in quarter ended Jun 2026 is 27.43% vs 18.76% in Mar 2026

Direction Arrows
Standalone Net Profit

QoQ Growth in quarter ended Jun 2026 is 63.05% vs 31.52% in Mar 2026

Half Yearly Results Snapshot (Standalone) - Sep'25stock-summary

Sep'25
Sep'24
Change(%)
Net Sales
154.65
108.19
42.94%
Operating Profit (PBDIT) excl Other Income
30.63
20.09
52.46%
Interest
0.14
0.15
-6.67%
Exceptional Items
0.00
0.00
Standalone Net Profit
19.68
13.80
42.61%
Operating Profit Margin (Excl OI)
19.81%
18.57%
1.24%
Values in Rs Cr.
Direction Arrows
Net Sales

Growth in half year ended Sep 2025 is 42.94% vs -13.66% in Sep 2024

Direction Arrows
Standalone Net Profit

Growth in half year ended Sep 2025 is 42.61% vs -34.78% in Sep 2024

Nine Monthly Results Snapshot (Standalone) - Dec'25stock-summary

Dec'25
Dec'24
Change(%)
Net Sales
245.27
160.70
52.63%
Operating Profit (PBDIT) excl Other Income
48.35
28.70
68.47%
Interest
0.22
0.26
-15.38%
Exceptional Items
0.00
0.00
Standalone Net Profit
31.45
19.04
65.18%
Operating Profit Margin (Excl OI)
19.71%
17.86%
1.85%
Values in Rs Cr.
Direction Arrows
Net Sales

YoY Growth in nine months ended Dec 2025 is 52.63% vs -14.68% in Dec 2024

Direction Arrows
Standalone Net Profit

YoY Growth in nine months ended Dec 2025 is 65.18% vs -37.64% in Dec 2024

Annual Results Snapshot (Standalone) - Mar'26stock-summary

Mar'26
Mar'25
Change(%)
Net Sales
352.89
218.92
61.20%
Operating Profit (PBDIT) excl Other Income
70.02
37.36
87.42%
Interest
0.31
0.38
-18.42%
Exceptional Items
0.00
0.00
Standalone Net Profit
46.93
24.39
92.41%
Operating Profit Margin (Excl OI)
19.84%
17.07%
2.77%
Values in Rs Cr.
Direction Arrows
Net Sales

YoY Growth in year ended Mar 2026 is 61.20% vs -13.61% in Mar 2025

Direction Arrows
Standalone Net Profit

YoY Growth in year ended Mar 2026 is 92.41% vs -38.63% in Mar 2025

stock-summaryCompany CV
About Divgi Torqtransfer Systems Ltd stock-summary
stock-summary
Divgi Torqtransfer Systems Ltd
Small Cap
Auto Components & Equipments
Divgi TorqTransfer Systems Limited was originally incorporated as a Private Limited Company with the name "Divgi Metalwares Private Limited" on December 16, 1964, issued by the Registrar of Companies, Maharashtra at Mumbai and later on, was changed to "Divgi TorqTransfer Systems Limited" upon conversion to a Public Limited Company vide a fresh Certificate of Incorporation on March 10, 2022 by the RoC.
Company Coordinates stock-summary
Icon
No Company Details Available