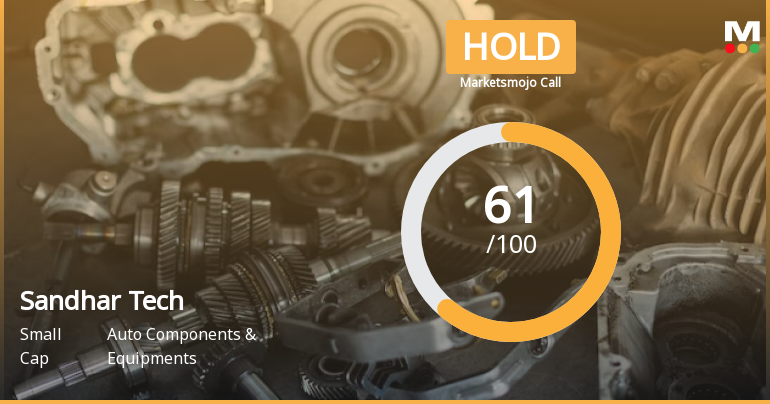
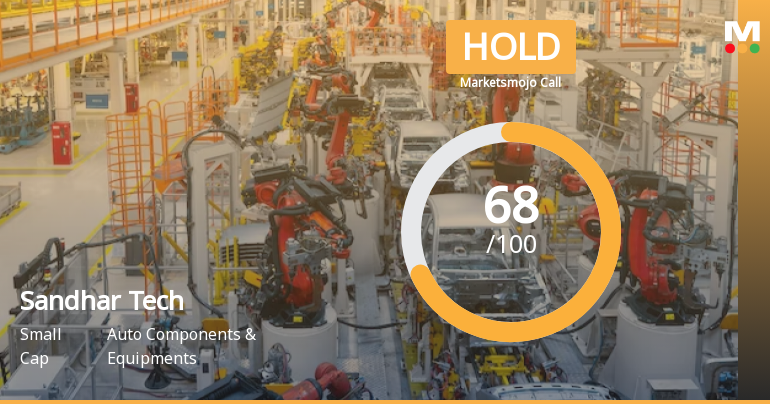
Sandhar Tech

  • Market Cap: Small Cap
  • Industry: Auto Components & Equipments
  • ISIN: INE278H01035
  • NSEID: SANDHAR
  • BSEID: 541163
INR
597.00
-13 (-2.13%)
BSENSE

Sep 16, 11:00 AM

BSE+NSE Vol: 90.71 k

  • Price Points
  • Score
  • Mojo Parameters
  • Total Return
  • News and Corporate Actions
  • Key factors
  • Shareholding
  • Financials
  • CompanyCV
stock-summaryPrice Point
High/Low

1Day

52 Week

Valuation
Technical
Day's Volume

CASH

90.71 k (104.60%) Volume

Shareholding (Jun 2026)

FII

2.09%

Held by 46 FIIs

DII

14.82%

Held by 16 DIIs

Promoter

70.38%

Why is Sandhar Technologies Limited falling/rising?

06-Sep-2026

As of 05-Sep, Sandhar Technologies Limited's stock is declining, down -0.65% and underperforming its sector. Despite strong financial performance over the last four quarters, recent price movements indicate short-term selling pressure and decreased investor interest.

As of 05-Sep, Sandhar Technologies Limited's stock price is currently falling, as indicated by a change of -4.1, or -0.65%. The stock has been underperforming, having lost -4.24% over the last three days, which contributes to the current decline. Additionally, the stock's performance today has underperformed its sector by -0.31%. <BR><BR>Investor participation has also decreased, with the delivery volume dropping by -49.73% compared to the 5-day average, suggesting reduced interest from investors. Although the stock is trading above its 100-day and 200-day moving averages, it is below its 5-day, 20-day, and 50-day moving averages, indicating a short-term downward trend.<BR><BR>Despite these negative indicators, it is important to note that the company has shown strong financial performance over the last four quarters, with significant growth in profit before tax, net sales, and profit after tax. However, the recent price movement reflects a combination of short-term selling pressure and declining investor engagement rather than a fundamental deterioration in the company's financial health.

View full answer

Who are in the management team of Sandhar Tech?

01-Sep-2026

The management team of Sandhar Tech includes D N Davar (Chairman), Jayant Davar (Co-Chairman & Managing Director), and several independent and non-executive directors, responsible for guiding the company's strategic direction and operations.

The management team of Sandhar Tech includes the following key individuals:<BR><BR>1. **D N Davar** - Chairman & Non-Executive Director<BR>2. **Jayant Davar** - Co-Chairman & Managing Director<BR>3. **Monica Davar** - Non-Executive & Non-Independent Director<BR>4. **Neel Jay Davar** - Non-Executive & Non-Independent Director<BR>5. **Sandeep Dinodia** - Non-Executive & Non-Independent Director<BR>6. **Arjun Sharma** - Independent Non-Executive Director<BR>7. **Arvind Kapur** - Independent Non-Executive Director<BR>8. **Archana Capoor** - Independent Non-Executive Director<BR>9. **Vimal Mahendru** - Independent Non-Executive Director<BR>10. **Bharat Anand** - Independent Non-Executive Director<BR>11. **Vikrampati Singhania** - Independent Non-Executive Director<BR><BR>This team is responsible for guiding the company's strategic direction and overseeing its operations.

View full answer

What does Sandhar Tech do?

01-Sep-2026

Sandhar Technologies Limited is a small-cap company in the auto components industry, reporting net sales of ₹1,382 Cr and a net profit of ₹37 Cr for June 2026. Founded in 1987, it has a market cap of ₹3,930 Cr and key metrics include a P/E of 19.00 and a dividend yield of 0.53%.

Overview: <BR>Sandhar Technologies Limited operates in the auto components and equipment industry and is categorized as a small-cap company.<BR><BR>History: <BR>The company was incorporated in 1987 as Sandhar Locking Devices Private Limited and later changed its name upon becoming a public limited company in 1992. The latest quarterly results report net sales and profit for June 2026.<BR><BR>Financial Snapshot: <BR>Net Sales: 1,382 Cr (Quarterly Results - Jun 2026) <BR>Net Profit: 37 Cr (Quarterly Results - Jun 2026) <BR>Market Cap: INR 3,930 Cr (Small Cap)<BR><BR>Key Metrics: <BR>P/E: 19.00 <BR>Industry P/E: 41 <BR>Dividend Yield: 0.53% <BR>Debt-Equity: 0.82 <BR>Return on Equity: 15.06% <BR>Price to Book: 2.96<BR><BR>Contact Details: <BR>Address: B-6/20 LSC, Safdarjung Enclave New Delhi New Delhi : 110049 <BR>Tel: 91-11-40511800 <BR>Email: info@sandhar.in <BR>Website: http://www.sandhargroup.com

View full answer

Who are the peers of the Sandhar Tech?

01-Sep-2026

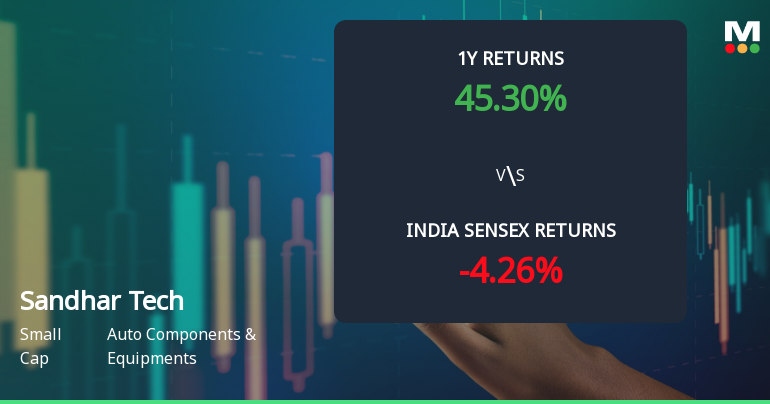
Sandhar Tech's peers include Rolex Rings, Jamna Auto Inds., Subros, Steel Str. Wheel, NRB Bearings, Uniparts India, Wheels India, Divgi Torq, and JTEKT India. Sandhar Tech has a good management risk rating and a 1-year return of 50.66%, while Uniparts India leads with a 126.09% return.

Peers: The peers of Sandhar Tech are Rolex Rings, Jamna Auto Inds., Subros, Steel Str. Wheel, NRB Bearings, Uniparts India, Wheels India, Divgi Torq, and JTEKT India.<BR><BR>Quality Snapshot: Excellent management risk is observed at Rolex Rings, Jamna Auto Inds., Wheels India, NRB Bearings, Divgi Torq, and JTEKT India, while Good management risk is found at Steel Str. Wheel and Sandhar Tech. Average management risk is noted for Subros and Uniparts India, while Rane (Madras) also falls into the Average category. Below Average growth is seen at Rolex Rings, Jamna Auto Inds., Subros, Steel Str. Wheel, NRB Bearings, Uniparts India, Sandhar Tech, and Divgi Torq, while Wheels India shows Good growth. <BR><BR>Return Snapshot: Uniparts India has the highest 1-year return at 126.09%, while Subros has the lowest at -17.64%. Sandhar Tech's 1-year return of 50.66% is significantly higher than Subros but lower than Uniparts India. Additionally, Subros and JTEKT India have negative six-month returns.

View full answer

How big is Sandhar Tech?

01-Sep-2026

As of 31st August, Sandhar Technologies Limited has a market capitalization of 3,930.00 Cr, with recent net sales of 5,143.89 Cr and a net profit of 207.93 Cr. The company has shareholder's funds of 1,333.13 Cr and total assets of 3,459.11 Cr as of March 2026.

As of 31st August, Sandhar Technologies Limited has a market capitalization of 3,930.00 Cr, categorizing it as a Small Cap company.<BR><BR>In the latest four quarters, Sandhar Technologies reported Net Sales of 5,143.89 Cr and a Net Profit of 207.93 Cr.<BR><BR>For the latest annual period ending in March 2026, the company has Shareholder's Funds amounting to 1,333.13 Cr and Total Assets of 3,459.11 Cr.

View full answer

Should I buy, sell or hold Sandhar Technologies Limited?

13-Aug-2026

When is the next results date for Sandhar Technologies Limited?

06-Aug-2026

The next results date for Sandhar Technologies Limited is August 11, 2026.

The next results date for Sandhar Technologies Limited is scheduled for August 11, 2026.

View full answer

Are Sandhar Technologies Limited latest results good or bad?

22-May-2026

Sandhar Technologies Limited's latest Q4 FY26 results are strong, with a net profit of ₹63.82 crore, up 90.79% quarter-on-quarter and 49.78% year-on-year, alongside record net sales of ₹1,306.99 crore. The company shows effective cost management and improved operational performance, indicating a positive outlook in the recovering automotive sector.

Sandhar Technologies Limited's latest results for Q4 FY26 are quite strong, indicating a positive performance overall. The company reported a net profit of ₹63.82 crore, which represents a remarkable increase of 90.79% quarter-on-quarter and 49.78% year-on-year. This significant growth in net profit reflects the company's ability to effectively capitalize on market opportunities.<BR><BR>Net sales also reached an all-time high of ₹1,306.99 crore, showing a 10.33% increase from the previous quarter and a robust 28.88% increase compared to the same quarter last year. This growth is largely attributed to strong demand in the automotive sector and improved operational execution.<BR><BR>Additionally, the operating margin improved to 9.87%, up from 9.13% in the previous quarter, demonstrating effective cost management. The return on equity (ROE) has also strengthened to 14.00%, indicating enhanced capital efficiency.<BR><BR>Overall, these results suggest that Sandhar Technologies is on a positive trajectory, benefiting from favorable market conditions and operational improvements. The company appears well-positioned to continue its growth in the recovering automotive sector.

View full answer

Is Sandhar Tech technically bullish or bearish?

27-Nov-2025

As of 26 November 2025, Sandhar Tech's trend is bullish with strong indicators like a bullish MACD and moving averages, though caution is advised due to a bearish weekly RSI and mixed signals from Dow Theory.

As of 26 November 2025, the technical trend for Sandhar Tech has changed from mildly bullish to bullish. The current stance is bullish with strong indicators supporting this view. The MACD is bullish on both the weekly and monthly time frames, and Bollinger Bands also indicate bullish momentum on both time frames. Daily moving averages are bullish, reinforcing the positive trend. However, the weekly RSI is bearish, which suggests some caution, while the KST shows a mildly bearish signal on the monthly. Dow Theory presents a mixed picture with a mildly bearish weekly stance but a mildly bullish monthly outlook. Overall, the strength of the bullish trend is supported by the positive performance against the Sensex, particularly over the 1-week and 1-month periods.

View full answer

How has been the historical performance of Sandhar Tech?

15-Nov-2025

Sandhar Tech has shown significant growth in net sales, increasing from 1,863.57 crore in March 2021 to 3,884.50 crore in March 2025, with profit after tax rising from 66.48 crore in March 2020 to 131.94 crore in March 2025. The company's financial performance reflects robust growth and operational efficiency.

Answer:<BR>The historical performance of Sandhar Tech shows significant growth in net sales and profitability over the years, with the latest figures for March 2025 indicating net sales of 3,884.50 crore and a profit after tax of 131.94 crore.<BR><BR>Breakdown:<BR>Sandhar Tech has demonstrated a consistent upward trend in net sales, increasing from 1,863.57 crore in March 2021 to 3,884.50 crore in March 2025. This growth is accompanied by a rise in total operating income, which reached 3,884.50 crore in March 2025, up from 2,323.70 crore in March 2022. The raw material costs have also increased, reflecting the company's expanding operations, with costs rising to 2,407.38 crore in March 2025. Operating profit, excluding other income, has improved to 383.25 crore in March 2025, compared to 188.41 crore in March 2021. The profit before tax has also shown a positive trend, reaching 174.89 crore in March 2025, up from 89.22 crore in March 2021. The profit after tax has increased significantly to 131.94 crore in March 2025 from 66.48 crore in March 2020. Total assets have grown to 2,778.45 crore in March 2025, while total liabilities have also increased to 2,778.45 crore, indicating a balanced growth in the company's financial structure. Cash flow from operating activities has remained strong, with 274.00 crore reported in March 2024, contributing to a closing cash and cash equivalent of 33.00 crore. Overall, Sandhar Tech's financial performance reflects robust growth and operational efficiency over the years.

View full answer

Who are the top shareholders of the Sandhar Tech?

17-Jul-2025

The top shareholders of Sandhar Tech include promoters, mutual funds, and individual investors, with promoters holding the majority and no pledged holdings. Notably, Jayant Davar is the largest promoter, while Nippon Life India Trustee Ltd is the highest public shareholder at 4.26%, and individual investors hold 11.17% of the shares.

The top shareholders of Sandhar Tech include a mix of promoters, mutual funds, and individual investors. The majority shareholders are the promoters, with no pledged promoter holdings reported. Among the mutual funds, seven schemes collectively hold 15.58% of the shares. Foreign Institutional Investors (FIIs) have a smaller stake, holding 0.69% across 42 FIIs. <BR><BR>The promoter with the highest holding is Jayant Davar, although his specific percentage is not detailed. The highest public shareholder is Nippon Life India Trustee Ltd, which manages the Nippon India Small Cap Fund, holding 4.26%. Individual investors collectively hold 11.17% of the shares.

View full answer

Is Sandhar Tech overvalued or undervalued?

09-Jun-2025

As of May 19, 2025, Sandhar Technologies Ltd. is assessed as fairly valued with a valuation grade of attractive, featuring a PE ratio of 22.06, an EV to EBITDA of 10.25, and a PEG ratio of 0.81, while outperforming the Sensex with a return of 41.93% over the past month.

As of 19 May 2025, the valuation grade for Sandhar Technologies Ltd. has moved from very attractive to attractive. The company is currently assessed as fairly valued. Key ratios include a PE ratio of 22.06, an EV to EBITDA of 10.25, and a PEG ratio of 0.81, indicating a reasonable valuation relative to its growth prospects.<BR><BR>In comparison to its peers, Sandhar Technologies has a PE ratio that aligns closely with its peer average, while its EV to EBITDA ratio is also competitive. Notable peers include companies with similar valuations, reinforcing the attractiveness of Sandhar's current pricing. Additionally, Sandhar's stock has outperformed the Sensex in the past month, with a return of 41.93% compared to the Sensex's 3.81%, suggesting strong market sentiment despite the recent downgrade in valuation grade.

View full answer

Has Sandhar Tech declared dividend?

06-Jun-2025

Yes, Sandhar Technologies Limited has declared a 32% dividend, amounting to ₹3.20 per share, with an ex-date of September 17, 2024. The dividend yield is 0.62%, and while the company has shown strong long-term returns, recent performance has been mixed.

Sandhar Technologies Limited has declared a 32% dividend.<BR><BR>Dividend Details:<BR>- Percentage announced: 32%<BR>- Amount per share: ₹3.20<BR>- Ex-date: 17 Sep 2024<BR><BR>Dividend Yield: 0.62%<BR><BR>Total Returns by Period:<BR>In the last 6 months, the price return was -10.95%, with a dividend return of 0%, resulting in a total return of -10.95%.<BR><BR>Over the past year, the price return was -2.96%, while the dividend return was 0.58%, leading to a total return of -2.38%.<BR><BR>In the 2-year period, the price return was 79.62%, with a dividend return of 1.88%, culminating in a total return of 81.5%.<BR><BR>For the 3-year period, the price return was 117.89%, and the dividend return was 3.44%, resulting in a total return of 121.33%.<BR><BR>In the last 4 years, the price return was 113.78%, with a dividend return of 3.66%, leading to a total return of 117.44%.<BR><BR>Over the past 5 years, the price return was 238.8%, while the dividend return was 5.56%, resulting in a total return of 244.36%.<BR><BR>Overall, while Sandhar Technologies Limited has declared a dividend, the recent total returns indicate a mixed performance, with significant gains over longer periods but recent declines in shorter terms. The dividend yield remains modest, reflecting the company's current financial strategy.

View full answer
iScoreScore
Click here to find our call on this stock
Strong Sell
Sell
Hold
Buy
Strong Buy

Dashboard

1

The company has declared Positive results for the last 4 consecutive quarters

  • PBT LESS OI(Q) At Rs 39.00 cr has Grown at 131.04%
  • NET SALES(Q) Highest at Rs 1,381.89 cr
  • PAT(Q) At Rs 37.28 cr has Grown at 33.1%
2

With ROCE of 10.1, it has a Fair valuation with a 2 Enterprise value to Capital Employed

3

Falling Participation by Institutional Investors

4

Market Beating Performance

stock-summaryMojo Parameters

Mojo Parameters

Loading Valuation Snapshot...

Stock DNA

stock-summary
Industry

Auto Components & Equipments

stock-summary
Market cap

INR 3,555 Cr (Small Cap)

stock-summary
P/E

18.00

stock-summary
Industry P/E

17

stock-summary
Dividend Yield

0.65%

stock-summary
Debt Equity

0.82

stock-summary
Return on Equity

15.06%

stock-summary
Price to Book

2.76

Revenue and Profits:
Net Sales:
1,382 Cr
(Quarterly Results - Jun 2026)
Net Profit:
37 Cr
stock-summaryTotal Returns
Total Returns (Price + Dividend) stock-summary
Dividend Yield (0.65%)
TimePeriod
Price Return
Dividend Return
Total Return
3 Months
-13.24%
0.57%
-12.67%
6 Months
23.04%
0.84%
23.88%
1 Year
28.89%
0.88%
29.77%
2 Years
-1.75%
1.31%
-0.44%
3 Years
48.54%
2.61%
51.15%
4 Years
149.17%
5.70%
154.87%
5 Years
95.23%
5.37%
100.6%

Latest dividend: 3.9909589925734585 per share ex-dividend date: Sep-11-2026

Risk Adjusted Returns v/s stock-summary
Returns Beta
Icon
Beta has not been calculated since enough price history is not available
stock-summaryNews & Corporate Actions

Announcements stock-summary

Announcement under Regulation 30 (LODR)-Change in Management

03-Sep-2026 | Source : BSE

Resignation of Shri Vijay Dahiya from the position of Senior Management Personnel w.e.f. closing of business hours of 03rd September 2026.

Communication To Shareholders Of Sandhar Technologies Limited (The Company) Regarding Tax Deduction At Source (TDS) On Dividend

27-Aug-2026 | Source : BSE

Tax Communication at Source (TDS) on Dividend

Announcement under Regulation 30 (LODR)-Newspaper Publication

26-Aug-2026 | Source : BSE

Newspaper publication of completion of dispatch of Notice and Annual Report of 34th AGM

Corporate Actions stock-summary

stock-summary
BOARD MEETING

No Upcoming Board Meetings

stock-summary
DIVIDEND

Sandhar Technologies Limited has declared 40% dividend, ex-date: 11 Sep 26

stock-summary
SPLITS

No Splits history available

stock-summary
BONUS

No Bonus history available

stock-summary
RIGHTS

No Rights history available

stock-summaryKey Factors

Quality key factors stock-summary

Factor
Value
Sales Growth (5y)
19.12%
EBIT Growth (5y)
14.48%
EBIT to Interest (avg)
4.03
Debt to EBITDA (avg)
2.42
Net Debt to Equity (avg)
0.82
Sales to Capital Employed (avg)
1.89
Tax Ratio
23.15%
Dividend Payout Ratio
14.87%
Pledged Shares
0
Institutional Holding
16.91%
ROCE (avg)
9.78%
ROE (avg)
10.50%

Valuation key factors

Factor
Value
P/E Ratio
18
Industry P/E
17
Price to Book Value
2.76
EV to EBIT
17.85
EV to EBITDA
10.37
EV to Capital Employed
1.97
EV to Sales
0.93
PEG Ratio
0.34
Dividend Yield
0.65%
ROCE (Latest)
10.06%
ROE (Latest)
15.06%

Technicals key factors

Indicator
Weekly
Monthly
MACD
Mildly Bearish
Bullish
RSI
No Signal
No Signal
Bollinger Bands
Bearish
Mildly Bullish
Moving Averages
Mildly Bullish (Daily)
KST
Mildly Bearish
Bullish
Dow Theory
Mildly Bearish
Bullish
OBV
No Trend
No Trend
stock-summary Technical Indicator Scale: Bearish, Mildly Bearish, Sideways, Mildly Bullish, Bullish  Turned 
stock-summaryShareholding
Shareholding Snapshot : Jun 2026stock-summary
Shareholding Compare (%holding) stock-summary
Majority shareholders

Promoters

Pledged Promoter Holdings

None

Mutual Funds

Held by 11 Schemes (14.73%)

FIIs

Held by 46 FIIs (2.09%)

Promoter with highest holding

Jayant Davar (50.56%)

Highest Public shareholder

Nippon Life India Trustee Ltd-a/c Nippon India Small Cap Fund (4.13%)

Individual Investors Holdings

10.81%

stock-summaryFinancial
[
  {
    "link": "quarterly",
    "btn_text": "All Quarterly Results",
    "header": "Quarterly Results Snapshot (Consolidated) - Jun'26 - YoY",
    "rhs": [
      {
        "prefix": "Net Sales ",
        "suffix": "YoY Growth in quarter ended Jun 2026 is 26.77% vs 19.45% in Jun 2025",
        "dir": 1
      },
      {
        "prefix": "Consolidated Net Profit ",
        "suffix": "YoY Growth in quarter ended Jun 2026 is 33.10% vs -3.61% in Jun 2025",
        "dir": 1
      }
    ],
    "table": {
      "header": [
        "Jun'26",
        "Jun'25",
        "Change(%)"
      ],
      "body": [
        {
          "field": "Net Sales",
          "val1": "1,381.89",
          "val2": "1,090.09",
          "chgp": "26.77%",
          "chgp_class": "positive"
        },
        {
          "field": "Operating Profit (PBDIT) excl Other Income",
          "val1": "105.19",
          "val2": "82.39",
          "chgp": "27.67%",
          "chgp_class": "positive"
        },
        {
          "field": "Interest",
          "val1": "17.67",
          "val2": "17.20",
          "chgp": "2.73%",
          "chgp_class": "negative"
        },
        {
          "field": "Exceptional Items",
          "val1": "0.00",
          "val2": "0.00",
          "chgp": "",
          "chgp_class": "neutral"
        },
        {
          "field": "Consolidate Net Profit",
          "val1": "37.28",
          "val2": "28.01",
          "chgp": "33.10%",
          "chgp_class": "positive"
        },
        {
          "field": "Operating Profit Margin (Excl OI)",
          "val1": "7.61%",
          "val2": "7.56%",
          "chgp": "0.05%",
          "chgp_class": "positive"
        }
      ]
    }
  },
  {
    "link": "half-yearly",
    "btn_text": "All Half Yearly Results",
    "header": "Half Yearly Results Snapshot (Consolidated) - Sep'25",
    "rhs": [
      {
        "prefix": "Net Sales ",
        "suffix": " Growth in half year ended Sep 2025 is 24.45% vs 10.68% in Sep 2024",
        "dir": 1
      },
      {
        "prefix": "Consolidated Net Profit ",
        "suffix": " Growth in half year ended Sep 2025 is 46.77% vs 41.88% in Sep 2024",
        "dir": 1
      }
    ],
    "table": {
      "header": [
        "Sep'25",
        "Sep'24",
        "Change(%)"
      ],
      "body": [
        {
          "field": "Net Sales",
          "val1": "2,360.46",
          "val2": "1,896.73",
          "chgp": "24.45%",
          "chgp_class": "positive"
        },
        {
          "field": "Operating Profit (PBDIT) excl Other Income",
          "val1": "200.49",
          "val2": "184.49",
          "chgp": "8.67%",
          "chgp_class": "positive"
        },
        {
          "field": "Interest",
          "val1": "34.59",
          "val2": "28.06",
          "chgp": "23.27%",
          "chgp_class": "negative"
        },
        {
          "field": "Exceptional Items",
          "val1": "0.00",
          "val2": "0.00",
          "chgp": "",
          "chgp_class": "neutral"
        },
        {
          "field": "Consolidate Net Profit",
          "val1": "101.39",
          "val2": "69.08",
          "chgp": "46.77%",
          "chgp_class": "positive"
        },
        {
          "field": "Operating Profit Margin (Excl OI)",
          "val1": "8.49%",
          "val2": "9.73%",
          "chgp": "-1.24%",
          "chgp_class": "negative"
        }
      ]
    }
  },
  {
    "link": "nine-monthly",
    "btn_text": "All Nine Monthly Results",
    "header": "Nine Monthly Results Snapshot (Consolidated) - Dec'25",
    "rhs": [
      {
        "prefix": "Net Sales ",
        "suffix": "YoY Growth in nine months ended Dec 2025 is 23.50% vs 10.26% in Dec 2024",
        "dir": 1
      },
      {
        "prefix": "Consolidated Net Profit ",
        "suffix": "YoY Growth in nine months ended Dec 2025 is 36.16% vs 33.97% in Dec 2024",
        "dir": 1
      }
    ],
    "table": {
      "header": [
        "Dec'25",
        "Dec'24",
        "Change(%)"
      ],
      "body": [
        {
          "field": "Net Sales",
          "val1": "3,545.10",
          "val2": "2,870.42",
          "chgp": "23.50%",
          "chgp_class": "positive"
        },
        {
          "field": "Operating Profit (PBDIT) excl Other Income",
          "val1": "308.64",
          "val2": "279.45",
          "chgp": "10.45%",
          "chgp_class": "positive"
        },
        {
          "field": "Interest",
          "val1": "51.11",
          "val2": "41.97",
          "chgp": "21.78%",
          "chgp_class": "negative"
        },
        {
          "field": "Exceptional Items",
          "val1": "-2.78",
          "val2": "0.00",
          "chgp": "",
          "chgp_class": "neutral"
        },
        {
          "field": "Consolidate Net Profit",
          "val1": "134.84",
          "val2": "99.03",
          "chgp": "36.16%",
          "chgp_class": "positive"
        },
        {
          "field": "Operating Profit Margin (Excl OI)",
          "val1": "8.71%",
          "val2": "9.74%",
          "chgp": "-1.03%",
          "chgp_class": "negative"
        }
      ]
    }
  },
  {
    "link": "annual",
    "btn_text": "All Annual Results",
    "header": "Annual Results Snapshot (Consolidated) - Mar'26",
    "rhs": [
      {
        "prefix": "Net Sales ",
        "suffix": "YoY Growth in year ended Mar 2026 is 24.91% vs 10.32% in Mar 2025",
        "dir": 1
      },
      {
        "prefix": "Consolidated Net Profit ",
        "suffix": "YoY Growth in year ended Mar 2026 is 40.26% vs 29.02% in Mar 2025",
        "dir": 1
      }
    ],
    "table": {
      "header": [
        "Mar'26",
        "Mar'25",
        "Change(%)"
      ],
      "body": [
        {
          "field": "Net Sales",
          "val1": "4,852.09",
          "val2": "3,884.50",
          "chgp": "24.91%",
          "chgp_class": "positive"
        },
        {
          "field": "Operating Profit (PBDIT) excl Other Income",
          "val1": "437.63",
          "val2": "383.25",
          "chgp": "14.19%",
          "chgp_class": "positive"
        },
        {
          "field": "Interest",
          "val1": "68.77",
          "val2": "56.61",
          "chgp": "21.48%",
          "chgp_class": "negative"
        },
        {
          "field": "Exceptional Items",
          "val1": "-2.78",
          "val2": "2.32",
          "chgp": "-219.83%",
          "chgp_class": "negative"
        },
        {
          "field": "Consolidate Net Profit",
          "val1": "198.66",
          "val2": "141.64",
          "chgp": "40.26%",
          "chgp_class": "positive"
        },
        {
          "field": "Operating Profit Margin (Excl OI)",
          "val1": "9.02%",
          "val2": "9.87%",
          "chgp": "-0.85%",
          "chgp_class": "negative"
        }
      ]
    }
  }
]

Quarterly Results Snapshot (Consolidated) - Jun'26 - YoYstock-summary

Jun'26
Jun'25
Change(%)
Net Sales
1,381.89
1,090.09
26.77%
Operating Profit (PBDIT) excl Other Income
105.19
82.39
27.67%
Interest
17.67
17.20
2.73%
Exceptional Items
0.00
0.00
Consolidate Net Profit
37.28
28.01
33.10%
Operating Profit Margin (Excl OI)
7.61%
7.56%
0.05%
Values in Rs Cr.
Direction Arrows
Net Sales

YoY Growth in quarter ended Jun 2026 is 26.77% vs 19.45% in Jun 2025

Direction Arrows
Consolidated Net Profit

YoY Growth in quarter ended Jun 2026 is 33.10% vs -3.61% in Jun 2025

Half Yearly Results Snapshot (Consolidated) - Sep'25stock-summary

Sep'25
Sep'24
Change(%)
Net Sales
2,360.46
1,896.73
24.45%
Operating Profit (PBDIT) excl Other Income
200.49
184.49
8.67%
Interest
34.59
28.06
23.27%
Exceptional Items
0.00
0.00
Consolidate Net Profit
101.39
69.08
46.77%
Operating Profit Margin (Excl OI)
8.49%
9.73%
-1.24%
Values in Rs Cr.
Direction Arrows
Net Sales

Growth in half year ended Sep 2025 is 24.45% vs 10.68% in Sep 2024

Direction Arrows
Consolidated Net Profit

Growth in half year ended Sep 2025 is 46.77% vs 41.88% in Sep 2024

Nine Monthly Results Snapshot (Consolidated) - Dec'25stock-summary

Dec'25
Dec'24
Change(%)
Net Sales
3,545.10
2,870.42
23.50%
Operating Profit (PBDIT) excl Other Income
308.64
279.45
10.45%
Interest
51.11
41.97
21.78%
Exceptional Items
-2.78
0.00
Consolidate Net Profit
134.84
99.03
36.16%
Operating Profit Margin (Excl OI)
8.71%
9.74%
-1.03%
Values in Rs Cr.
Direction Arrows
Net Sales

YoY Growth in nine months ended Dec 2025 is 23.50% vs 10.26% in Dec 2024

Direction Arrows
Consolidated Net Profit

YoY Growth in nine months ended Dec 2025 is 36.16% vs 33.97% in Dec 2024

Annual Results Snapshot (Consolidated) - Mar'26stock-summary

Mar'26
Mar'25
Change(%)
Net Sales
4,852.09
3,884.50
24.91%
Operating Profit (PBDIT) excl Other Income
437.63
383.25
14.19%
Interest
68.77
56.61
21.48%
Exceptional Items
-2.78
2.32
-219.83%
Consolidate Net Profit
198.66
141.64
40.26%
Operating Profit Margin (Excl OI)
9.02%
9.87%
-0.85%
Values in Rs Cr.
Direction Arrows
Net Sales

YoY Growth in year ended Mar 2026 is 24.91% vs 10.32% in Mar 2025

Direction Arrows
Consolidated Net Profit

YoY Growth in year ended Mar 2026 is 40.26% vs 29.02% in Mar 2025

stock-summaryCompany CV
About Sandhar Technologies Limited stock-summary
stock-summary
Sandhar Technologies Limited
Small Cap
Auto Components & Equipments
Sandhar Technologies Limited was incorporated as Sandhar Locking Devices Private Limited on October 19, 1987, at New Delhi, India, as a Private Limited Company. The name of the Company was subsequently changed to Sandhar Locking Devices Limited on conversion to a Public Limited Company, and a fresh Certificate of Incorporation consequent upon change of name was issued by the Registrar of Companies, Delhi and Haryana, to the Company on September 21, 1992.
Company Coordinates stock-summary
Company Details
B-6/20 LSC, Safdarjung Enclave New Delhi New Delhi : 110049
stock-summary
Tel: 91-11-40511800
stock-summary
info@sandhar.in
Registrar Details
Link Intime India Pvt Ltd, C-13 Pannalal Silk Compound, L B S Marg, Bhandup , Mumbai