
Compare Divi's Lab. with Similar Stocks
Dashboard
High Management Efficiency with a high ROE of 16.32%
The company is Net-Debt Free
The company has declared Positive results for the last 8 consecutive quarters
High Institutional Holdings at 39.58%
Market Beating performance in long term as well as near term
With its market cap of Rs 2,14,553 cr, it is the second biggest company in the sector (behind Sun Pharma.Inds.)and constitutes 7.74% of the entire sector
Stock DNA
Pharmaceuticals & Biotechnology
INR 224,394 Cr (Large Cap)
82.00
37
0.37%
-0.20
15.65%
12.80
Total Returns (Price + Dividend) 
Latest dividend: 30.025481665630828 per share ex-dividend date: Jul-24-2026
Risk Adjusted Returns v/s
Returns Beta

News
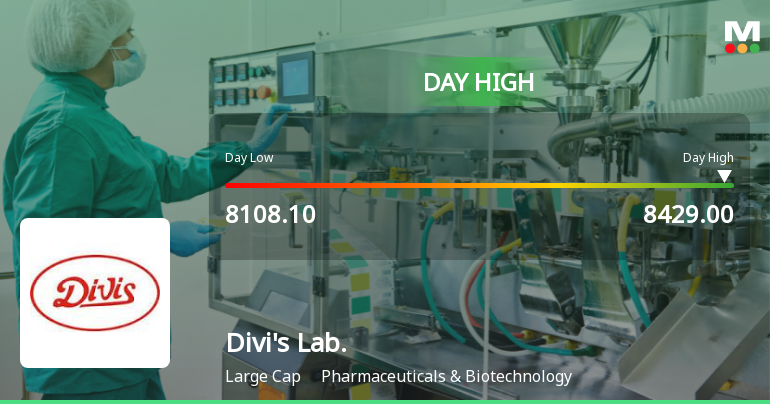
Divis Laboratories Ltd Rallies 3.91% and Hits New 52-Week High of Rs 8417.25
The Sensex slipped 0.75% on 3 Aug 2026, yet Divis Laboratories Ltd surged 3.91%, touching a fresh 52-week and all-time high of Rs 8417.25. That 3.16-percentage-point outperformance over the benchmark index signals a distinctly stock-specific strength rather than a market-wide rally.
Read full news article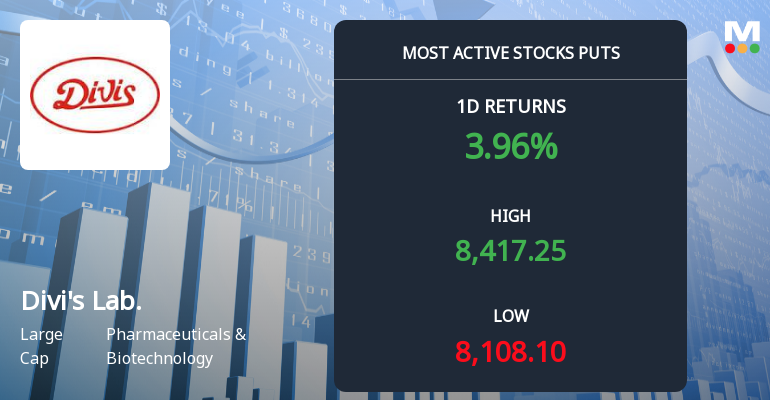
Rs 8,000 Puts — 4.6% Below Current Price — Draw 4,128 Contracts on Divis Laboratories Ltd
Rs 8,000 put options on Divis Laboratories Ltd attracted 4,128 contracts on 3 Aug 2026, signalling notable activity at a strike price 4.6% below the current market price of Rs 8,380. This surge in put volume comes amid a five-day rally that has lifted the stock by 8.66%, raising questions about whether this is a protective hedge or a bearish wager.
Read full news article
At-the-Money Calls on Divis Laboratories Ltd Draw 10,939 Contracts — A Signal of Immediate Directional Conviction
On 3 Aug 2026, Divis Laboratories Ltd witnessed significant call option activity, with 10,939 contracts traded at the Rs 8,400 strike price, precisely matching the stock’s closing price of Rs 8,400. This synchrony between the options strike and the underlying price highlights a strong directional bet on near-term price movement, supported by a 3.91% gain in the cash market on the same day.
Read full news article Announcements
Board Meeting Outcome for Outcome Of Board Meeting Held On August 01 2026.
01-Aug-2026 | Source : BSEOutcome of Board meeting held on August 01 2026.
Announcement under Regulation 30 (LODR)-Analyst / Investor Meet - Outcome
01-Aug-2026 | Source : BSEIntimation of Q1FY27 earnings call audio recording.
Announcement under Regulation 30 (LODR)-Change in Management
01-Aug-2026 | Source : BSEAs per enclosed letter.
Corporate Actions

No Upcoming Board Meetings

Divis Laboratories Ltd has declared 1500% dividend, ex-date: 24 Jul 26

Divis Laboratories Ltd has announced 2:10 stock split, ex-date: 03 Aug 07

Divis Laboratories Ltd has announced 1:1 bonus issue, ex-date: 23 Sep 15

No Rights history available
Quality key factors
Valuation key factors
Technicals key factors
 Technical Indicator Scale: Bearish, Mildly Bearish, Sideways, Mildly Bullish, Bullish Turned
 Shareholding Snapshot : Jun 2026
Shareholding Compare (%holding)
Promoters
None
Held by 46 Schemes (13.87%)
Held by 747 FIIs (20.2%)
Nilima Prasad Divi (20.34%)
Sbi Mutual Fund (3.9%)
6.41%
Quarterly Results Snapshot (Consolidated) - Jun'26 - QoQ

QoQ Growth in quarter ended Jun 2026 is 8.80% vs 8.72% in Mar 2026

QoQ Growth in quarter ended Jun 2026 is 20.11% vs 28.82% in Mar 2026
Half Yearly Results Snapshot (Consolidated) - Sep'25
Growth in half year ended Sep 2025 is 15.01% vs 20.86% in Sep 2024
Growth in half year ended Sep 2025 is 31.28% vs 33.52% in Sep 2024
Nine Monthly Results Snapshot (Consolidated) - Dec'25
YoY Growth in nine months ended Dec 2025 is 14.08% vs 22.25% in Dec 2024
YoY Growth in nine months ended Dec 2025 is 18.84% vs 43.97% in Dec 2024
Annual Results Snapshot (Consolidated) - Mar'26
YoY Growth in year ended Mar 2026 is 12.82% vs 19.31% in Mar 2025
YoY Growth in year ended Mar 2026 is 17.21% vs 36.94% in Mar 2025
About Divis Laboratories Ltd

Company Coordinates


