
Compare DMG MORI CO., LTD. with Similar Stocks
Dashboard
High Management Efficiency with a high ROCE of 10.52%
High Debt Company with a Debt to Equity ratio (avg) at times
Poor long term growth as Net Sales has grown by an annual rate of 2.91% over the last 5 years
The company has declared Negative results for the last 3 consecutive quarters
With ROCE of 8.93%, it has a very attractive valuation with a 1.62 Enterprise value to Capital Employed
Underperformed the market in the last 1 year
Stock DNA
Industrial Manufacturing
JPY 428,138 Million (Mid Cap)
26.00
NA
0.01%
0.97
5.43%
2.15
Total Returns (Price + Dividend) 
DMG MORI CO., LTD. for the last several years.
Risk Adjusted Returns v/s
News
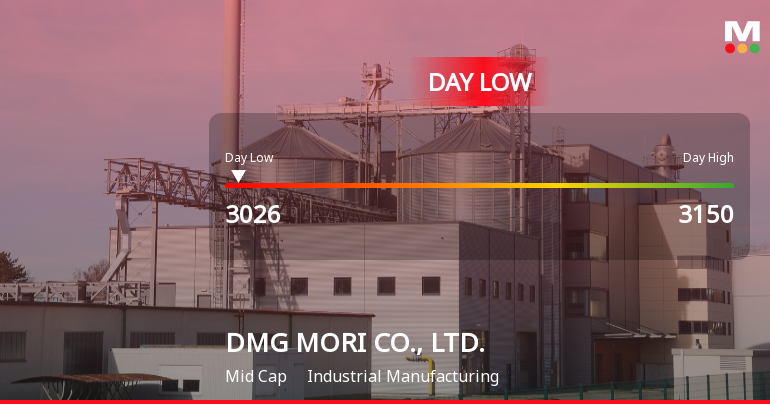
DMG MORI Stock Hits Day Low of JPY 3,026 Amid Price Pressure
DMG MORI CO., LTD. faced a notable stock decline today, reflecting ongoing operational challenges. The company reported a significant drop in net sales and pre-tax profit in the latest quarter, alongside three consecutive quarters of negative results. Its market capitalization stands at JPY 428,138 million.
Read full news article Announcements

Corporate Actions
Quality key factors
Valuation key factors
Technicals key factors
 Technical Indicator Scale: Bearish, Mildly Bearish, Sideways, Mildly Bullish, Bullish Turned
 Shareholding Snapshot : Sep 2012
Shareholding Compare (%holding)
Foreign Institutions
Held in 0 Schemes (0%)
Held by 1 Foreign Institutions (1.42%)
Quarterly Results Snapshot (Consolidated) - Jun'25 - YoY

YoY Growth in quarter ended Jun 2025 is -13.29% vs 3.60% in Jun 2024
YoY Growth in quarter ended Jun 2025 is -75.36% vs -6.99% in Jun 2024
Annual Results Snapshot (Consolidated) - Dec'24
YoY Growth in year ended Dec 2024 is 0.28% vs 13.62% in Dec 2023
YoY Growth in year ended Dec 2024 is -36.59% vs 40.05% in Dec 2023
About DMG MORI CO., LTD.

Company Coordinates


