
Compare DocGo, Inc. with Similar Stocks
Dashboard
With a fall in Operating Profit of -478.14%, the company declared Very Negative results in Jun 25
- The company has declared negative results for the last 2 consecutive quarters
- INTEREST(9M) At USD 1.41 MM has Grown at 59.9%
- ROCE(HY) Lowest at -5.98%
- NET SALES(Q) Lowest at USD 80.42 MM
Risky - Negative Operating Profits
Consistent Underperformance against the benchmark over the last 3 years
Stock DNA
Pharmaceuticals & Biotechnology
USD 83 Million (Micro Cap)
NA (Loss Making)
NA
0.00%
-0.23
-16.74%
0.31
Total Returns (Price + Dividend) 
DocGo, Inc. for the last several years.
Risk Adjusted Returns v/s
News
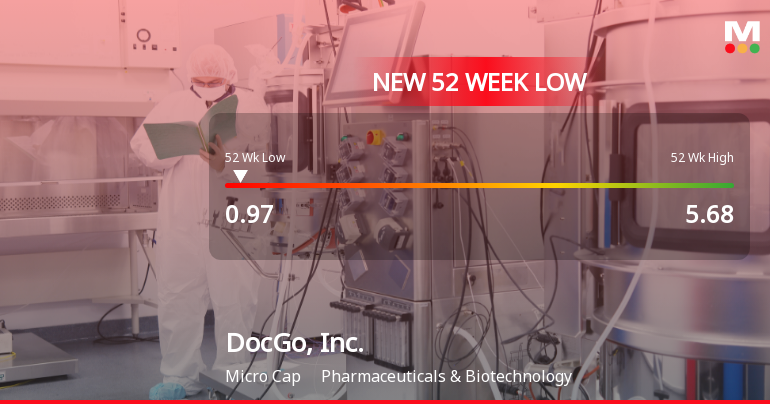
DocGo, Inc. Hits 52-Week Low of $0.97 Amid Ongoing Struggles
DocGo, Inc. has reached a new 52-week low, reflecting a substantial decline in its stock value over the past year. The company has reported negative operating profits and consecutive quarters of poor financial results, alongside a decrease in promoter stakes, indicating ongoing challenges in its market position.
Read full news article Announcements

Corporate Actions
Quality key factors
Valuation key factors
Technicals key factors
 Technical Indicator Scale: Bearish, Mildly Bearish, Sideways, Mildly Bullish, Bullish Turned
 Shareholding Snapshot : Sep 2025
Shareholding Compare (%holding)
Domestic Funds
Held in 42 Schemes (24.58%)
Held by 53 Foreign Institutions (4.31%)
Quarterly Results Snapshot (Consolidated) - Jun'25 - QoQ

QoQ Growth in quarter ended Jun 2025 is -16.25% vs -20.53% in Mar 2025
QoQ Growth in quarter ended Jun 2025 is -19.82% vs -46.05% in Mar 2025
Annual Results Snapshot (Consolidated) - Dec'24

YoY Growth in year ended Dec 2024 is -1.23% vs 41.73% in Dec 2023
YoY Growth in year ended Dec 2024 is 34.00% vs -67.43% in Dec 2023
About DocGo, Inc.

Company Coordinates


