
Compare Dr Agarwal's Eye with Similar Stocks
Dashboard
Healthy long term growth as Operating profit has grown by an annual rate 54.61%
The company has declared Positive results for the last 5 consecutive quarters
With ROCE of 17.3, it has a Fair valuation with a 4.5 Enterprise value to Capital Employed
29.26% of Promoter Shares are Pledged
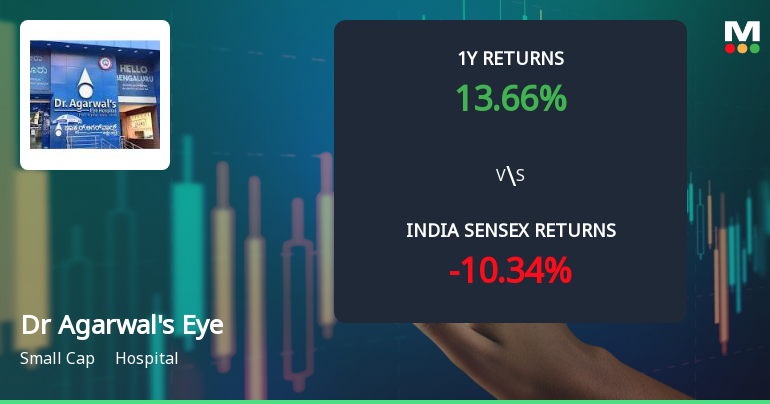
Consistent Returns over the last 3 years
Total Returns (Price + Dividend) 
Latest dividend: 3 per share ex-dividend date: Nov-07-2025
Risk Adjusted Returns v/s
Returns Beta

News
Dr Agarwals Eye Hospital Ltd Technical Momentum Shifts Amid Mixed Indicator Signals
Dr Agarwals Eye Hospital Ltd has experienced a notable shift in its technical momentum, moving from a sideways trend to a mildly bearish stance. Despite this, key indicators such as the MACD and KST on a weekly basis remain bullish, while monthly signals present a more cautious outlook. This nuanced technical picture, combined with the company’s recent upgrade to a Hold rating from Sell, invites a closer examination of its price action and momentum in the context of broader market performance.
Read full news article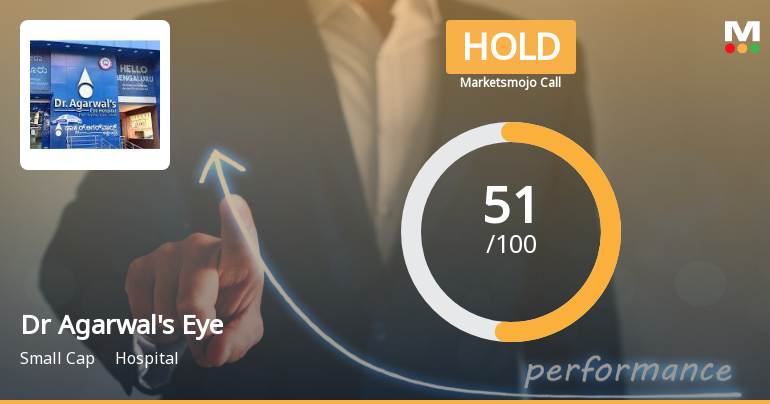
Dr Agarwals Eye Hospital Ltd Upgraded to Hold on Technical and Financial Improvements
Dr Agarwals Eye Hospital Ltd has seen its investment rating upgraded from Sell to Hold, reflecting a notable improvement in its technical indicators and sustained financial performance. The revision comes amid a stabilising technical trend, healthy profit growth, and a fair valuation relative to peers, signalling cautious optimism for investors in this small-cap hospital sector stock.
Read full news article
Dr Agarwals Eye Hospital Ltd Technical Momentum Shifts Amid Mixed Signals
Dr Agarwals Eye Hospital Ltd has experienced a notable shift in its technical momentum, moving from a mildly bearish stance to a sideways trend, prompting an upgrade in its MarketsMOJO rating from Sell to Hold as of 8 June 2026. Despite a day decline of 1.77%, the stock’s mixed technical signals suggest a period of consolidation amid broader market volatility.
Read full news article Announcements
Letter To Equity Shareholders And Creditors
01-Jun-2026 | Source : BSELetter providing direct weblink and a Static Quick Response Code to the Notice of the Equity Shareholders and Creditors dispatched by the Company is submitted.
Announcement under Regulation 30 (LODR)-Scheme of Arrangement
01-Jun-2026 | Source : BSENotice convening the meeting of the unsecured creditors of the Company pursuant to the order of the Honble Tribunal Chennai Bench is submitted.
Notice Convening Meeting Of The Equity Shareholders Of The Company Pursuant To The Order Of Honble NCLT Chennai Bench
01-Jun-2026 | Source : BSENotice convening the Meeting of the Equity Shareholders of the Company pursuant to the Order of Honble NCLT Chennai Bench is submitted.
Corporate Actions

No Upcoming Board Meetings

Dr Agarwals Eye Hospital Ltd has declared 30% dividend, ex-date: 07 Nov 25

No Splits history available

No Bonus history available

No Rights history available
Quality key factors
Valuation key factors
Technicals key factors
 Technical Indicator Scale: Bearish, Mildly Bearish, Sideways, Mildly Bullish, Bullish Turned
 Shareholding Snapshot : Mar 2026
Shareholding Compare (%holding)
Promoters
29.2618
Held by 3 Schemes (0.03%)
Held by 3 FIIs (2.2%)
Dr Agarwals Health Care Limited (72.67%)
Malabar India Fund Limited (2.14%)
17.93%
Quarterly Results Snapshot (Standalone) - Mar'26 - YoY

YoY Growth in quarter ended Mar 2026 is 20.21% vs 23.67% in Mar 2025
YoY Growth in quarter ended Mar 2026 is 1.56% vs 25.02% in Mar 2025
Half Yearly Results Snapshot (Standalone) - Sep'25
Growth in half year ended Sep 2025 is 16.04% vs 24.33% in Sep 2024

Growth in half year ended Sep 2025 is 29.44% vs 17.12% in Sep 2024
Nine Monthly Results Snapshot (Standalone) - Dec'25
YoY Growth in nine months ended Dec 2025 is 18.01% vs 24.62% in Dec 2024
YoY Growth in nine months ended Dec 2025 is 39.32% vs 15.16% in Dec 2024
Annual Results Snapshot (Standalone) - Mar'26
YoY Growth in year ended Mar 2026 is 18.56% vs 24.38% in Mar 2025
YoY Growth in year ended Mar 2026 is 28.27% vs 17.88% in Mar 2025
About Dr Agarwals Eye Hospital Ltd

Company Coordinates


