
Compare Dr Agarwal's Hea with Similar Stocks
Dashboard
Strong ability to service debt as the company has a low Debt to EBITDA ratio of 1.87 times
Healthy long term growth as Net Sales has grown by an annual rate of 26.90%
The company has declared Positive results for the last 5 consecutive quarters
With ROCE of 10.4, it has a Expensive valuation with a 5.8 Enterprise value to Capital Employed
High Institutional Holdings at 65.68%
Market Beating Performance
Total Returns (Price + Dividend) 
Dr Agarwal's Hea for the last several years.
Risk Adjusted Returns v/s
Returns Beta

News
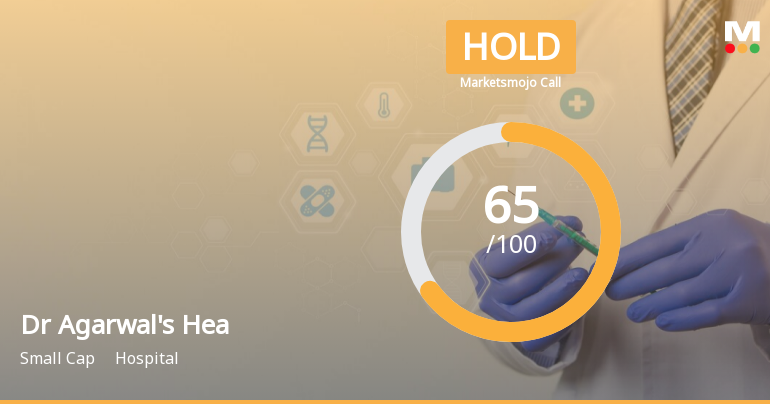
Dr Agarwals Health Care Ltd is Rated Hold
Dr Agarwals Health Care Ltd is rated 'Hold' by MarketsMOJO, with this rating last updated on 18 Mar 2026. However, the analysis and financial metrics discussed here reflect the stock's current position as of 18 July 2026, providing investors with an up-to-date view of the company’s fundamentals, returns, and market performance.
Read full news article
Dr Agarwals Health Care Ltd Shows Mildly Bullish Momentum Amid Technical Shifts
Dr Agarwals Health Care Ltd has exhibited a notable shift in its technical momentum, transitioning from a sideways trend to a mildly bullish stance. This change is underscored by a combination of technical indicators including MACD, Bollinger Bands, and moving averages, signalling a cautious yet optimistic outlook for the hospital sector stock.
Read full news article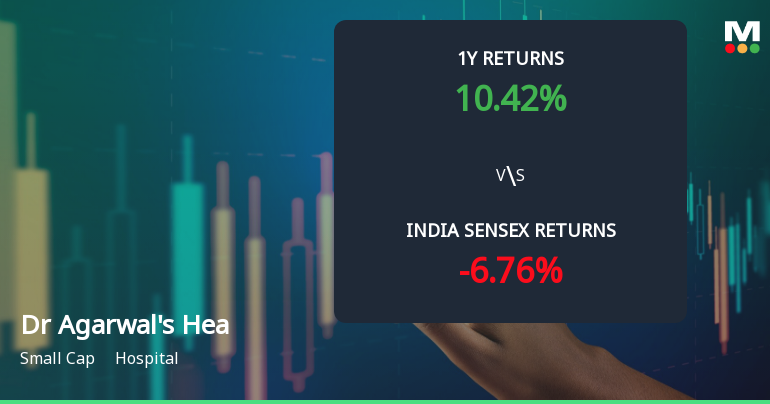
Dr Agarwals Health Care Ltd Technical Momentum Shifts Amid Sideways Trend
Dr Agarwals Health Care Ltd, a small-cap player in the hospital sector, has witnessed a notable shift in its technical momentum, transitioning from a mildly bullish stance to a sideways trend. Despite a modest day decline of 0.33%, the stock’s technical indicators reveal a complex interplay of signals that investors should carefully analyse amid broader market conditions.
Read full news article Announcements
Announcement under Regulation 30 (LODR)-Allotment of ESOP / ESPS
09-Jul-2026 | Source : BSEAllotment of 43155 Equity Shares pursuant to the exercise of options granted under Dr. Agarwals Health Care Limited - Employee Stock Option Scheme 2022.
Compliances-Certificate under Reg. 74 (5) of SEBI (DP) Regulations 2018
07-Jul-2026 | Source : BSECertificate under Regulation 74(5) of the SEBI (Depositories and Participants) Regulations 2018 for the quarter ended June 30 2026 is enclosed.
Voting Results And The Consolidated Scrutinizers Report On The NCLT Convened Meeting Of The Equity Shareholders Of Dr. Agarwals Health Care Limited Held On July 02 2026.
02-Jul-2026 | Source : BSEVoting Results and the Consolidated Scrutinizers Report on the Honble NCLT convened meeting of the Equity Shareholders of Dr. Agarwals Health Care Limited held on July 02 2026 is enclosed.
Corporate Actions

No Upcoming Board Meetings

No Dividend history available

No Splits history available

No Bonus history available

No Rights history available
Quality key factors
Valuation key factors
Technicals key factors
 Technical Indicator Scale: Bearish, Mildly Bearish, Sideways, Mildly Bullish, Bullish Turned
 Shareholding Snapshot : Jun 2026
Shareholding Compare (%holding)
FIIs
None
Held by 11 Schemes (6.02%)
Held by 70 FIIs (57.96%)
Ashvin Agarwal (4.45%)
Hyperion Investments Pte. Ltd. (23.09%)
1.81%
Quarterly Results Snapshot (Consolidated) - Mar'26 - QoQ

QoQ Growth in quarter ended Mar 2026 is 6.46% vs 6.25% in Dec 2025
QoQ Growth in quarter ended Mar 2026 is 17.69% vs 13.64% in Dec 2025
Half Yearly Results Snapshot (Consolidated) - Sep'25

Growth in half year ended Sep 2025 is 20.25% vs 26.05% in Sep 2024
Growth in half year ended Sep 2025 is 109.17% vs 16.62% in Sep 2024
Nine Monthly Results Snapshot (Consolidated) - Dec'25
YoY Growth in nine months ended Dec 2025 is 21.20% vs 2.97% in Dec 2024
YoY Growth in nine months ended Dec 2025 is 83.65% vs -20.72% in Dec 2024
Annual Results Snapshot (Consolidated) - Mar'26
YoY Growth in year ended Mar 2026 is 21.57% vs 28.44% in Mar 2025
YoY Growth in year ended Mar 2026 is 59.59% vs 0.48% in Mar 2025
About Dr Agarwals Health Care Ltd

Company Coordinates


