
Compare Dredging Corpn. with Similar Stocks
Dashboard
Weak Long Term Fundamental Strength with an average Return on Capital Employed (ROCE) of 1.70%
- Poor long term growth as Net Sales has grown by an annual rate of 9.61% over the last 5 years
- Company's ability to service its debt is weak with a poor EBIT to Interest (avg) ratio of 0.82
With a growth in Operating Profit of 321.29%, the company declared Very Positive results in Mar 26
With ROCE of 0.9, it has a Attractive valuation with a 1.8 Enterprise value to Capital Employed
Majority shareholders : Promoters
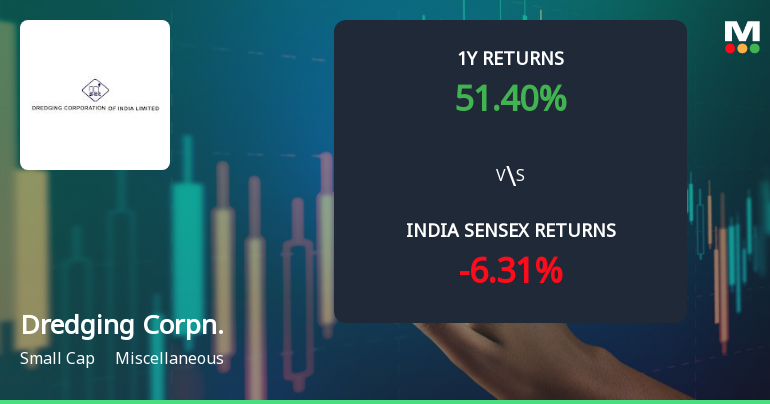
Market Beating performance in long term as well as near term
Stock DNA
Miscellaneous
INR 2,977 Cr (Small Cap)
604.00
9
0.00%
0.88
0.42%
2.59
Total Returns (Price + Dividend) 
Latest dividend: 3 per share ex-dividend date: Jul-31-2019
Risk Adjusted Returns v/s
Returns Beta

News
Dredging Corporation of India Ltd: Technical Momentum Shifts Amid Mixed Market Signals
Dredging Corporation of India Ltd (DCI) has experienced a nuanced shift in its technical momentum, moving from a bullish to a mildly bullish stance as of early July 2026. Despite a recent day decline of 2.58%, the stock’s technical indicators present a complex picture, with some signals pointing to sustained strength while others suggest caution. This analysis delves into the latest technical parameters, price momentum, and comparative returns to provide a comprehensive view for investors.
Read full news article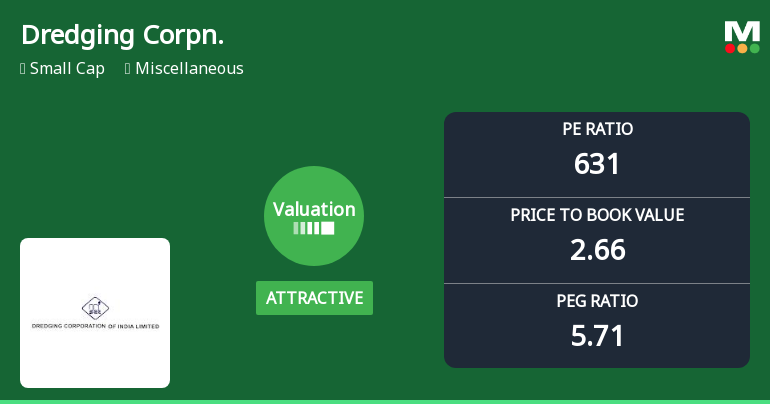
Dredging Corporation of India Ltd: Valuation Shifts Signal Renewed Price Attractiveness
Dredging Corporation of India Ltd has witnessed a notable shift in its valuation parameters, moving from a fair to an attractive rating. Despite a recent dip in share price, the company’s price-to-earnings (P/E) and price-to-book value (P/BV) ratios suggest a compelling investment case relative to its historical averages and peer group, prompting a reassessment of its market standing.
Read full news article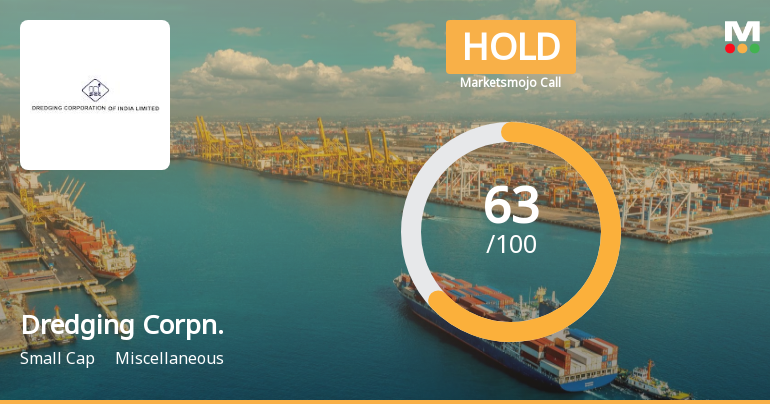
Dredging Corporation of India Ltd is Rated Hold
Dredging Corporation of India Ltd is rated 'Hold' by MarketsMOJO, with this rating last updated on 20 May 2026. However, the analysis and financial metrics presented here reflect the stock’s current position as of 04 July 2026, providing investors with the most recent insights into its performance and outlook.
Read full news article Announcements
Shareholder Meeting / Postal Ballot-Notice of Postal Ballot
06-Jul-2026 | Source : BSEAs attached
Closure of Trading Window
23-Jun-2026 | Source : BSEAs attached
Announcement under Regulation 30 (LODR)-Change in Management
09-Jun-2026 | Source : BSEAs attached
Corporate Actions

No Upcoming Board Meetings

Dredging Corporation of India Ltd has declared 30% dividend, ex-date: 31 Jul 19

No Splits history available

No Bonus history available

No Rights history available
Quality key factors
Valuation key factors
Technicals key factors
 Technical Indicator Scale: Bearish, Mildly Bearish, Sideways, Mildly Bullish, Bullish Turned
 Shareholding Snapshot : Mar 2026
Shareholding Compare (%holding)
Promoters
None
Held by 2 Schemes (4.54%)
Held by 23 FIIs (0.38%)
Visakhapatnam Port Trust (19.47%)
Life Insurance Corporation Of India (3.92%)
15.41%
Quarterly Results Snapshot (Standalone) - Mar'26 - QoQ

QoQ Growth in quarter ended Mar 2026 is 73.22% vs 30.36% in Dec 2025
QoQ Growth in quarter ended Mar 2026 is 452.86% vs 27.94% in Dec 2025
Half Yearly Results Snapshot (Standalone) - Sep'25
Growth in half year ended Sep 2025 is 27.79% vs -11.66% in Sep 2024
Growth in half year ended Sep 2025 is 11.40% vs -303.29% in Sep 2024
Nine Monthly Results Snapshot (Standalone) - Dec'25
YoY Growth in nine months ended Dec 2025 is 7.41% vs 1.82% in Dec 2024
YoY Growth in nine months ended Dec 2025 is -68.15% vs -182.57% in Dec 2024
Annual Results Snapshot (Standalone) - Mar'26

YoY Growth in year ended Mar 2026 is 5.80% vs 20.80% in Mar 2025
YoY Growth in year ended Mar 2026 is 117.30% vs -182.76% in Mar 2025
About Dredging Corporation of India Ltd

Company Coordinates


