
Compare Dredging Corpn. with Similar Stocks
Dashboard
Weak Long Term Fundamental Strength with an average Return on Capital Employed (ROCE) of 1.70%
- Poor long term growth as Net Sales has grown by an annual rate of 9.61% over the last 5 years
- Company's ability to service its debt is weak with a poor EBIT to Interest (avg) ratio of 0.82
With a growth in Operating Profit of 321.29%, the company declared Very Positive results in Mar 26
With ROCE of 0.9, it has a Attractive valuation with a 1.8 Enterprise value to Capital Employed
Majority shareholders : Promoters
Market Beating performance in long term as well as near term
Stock DNA
Miscellaneous
INR 2,976 Cr (Small Cap)
610.00
9
0.00%
0.88
0.42%
2.57
Total Returns (Price + Dividend) 
Latest dividend: 3 per share ex-dividend date: Jul-31-2019
Risk Adjusted Returns v/s
Returns Beta

News
Dredging Corporation of India Ltd is Rated Hold
Dredging Corporation of India Ltd is rated 'Hold' by MarketsMOJO, with this rating last updated on 20 May 2026. However, the analysis and financial metrics presented here reflect the company’s current position as of 12 June 2026, providing investors with the latest insights into its performance and outlook.
Read full news article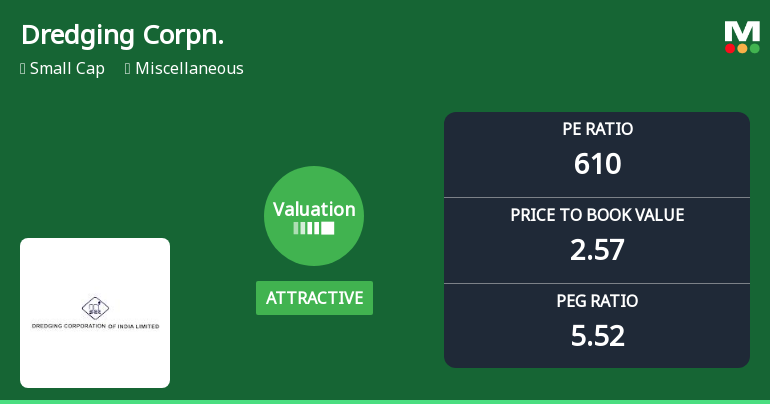
Dredging Corporation of India Ltd: Valuation Shifts Signal Renewed Price Attractiveness
Dredging Corporation of India Ltd has witnessed a notable shift in its valuation parameters, moving from a fair to an attractive rating, despite a recent dip in share price. This change reflects evolving investor sentiment amid contrasting financial metrics and peer comparisons, positioning the company as a compelling consideration within the miscellaneous sector.
Read full news article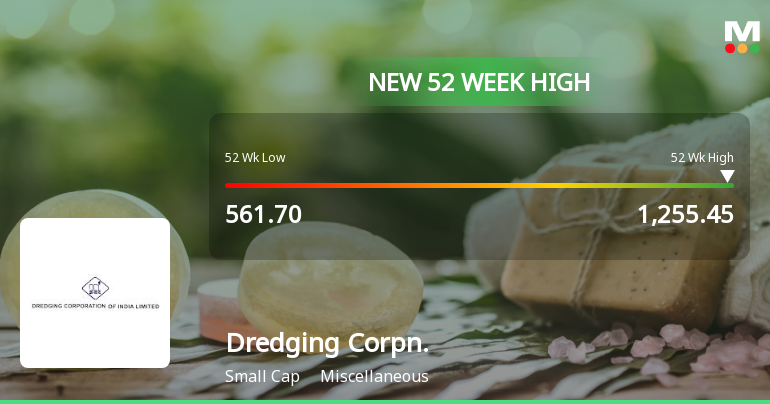
Broad-Based Technical Strength Lifts Dredging Corporation of India Ltd to 52-Week High of Rs 1255.45
Surging to a new 52-week high of Rs 1255.45 on 4 Jun 2026, Dredging Corporation of India Ltd has demonstrated remarkable price momentum, outperforming the broader market by a wide margin over the past year despite a recent mild pullback. This milestone caps a 58.58% rally from its 52-week low of Rs 561.70, underscoring a sustained uptrend fuelled by a confluence of bullish technical indicators across multiple timeframes.
Read full news article Announcements
Announcement under Regulation 30 (LODR)-Change in Management
09-Jun-2026 | Source : BSEAs attached
Shareholder Meeting / Postal Ballot-Scrutinizers Report
02-Jun-2026 | Source : BSEAS ATTACHED
Intimation Of Appointment Of Shri Jasmeet Singh Bindra IRTS As Chairman Of Visakhapatnam Port Authority -Reg
23-May-2026 | Source : BSEAs attached
Corporate Actions

No Upcoming Board Meetings

Dredging Corporation of India Ltd has declared 30% dividend, ex-date: 31 Jul 19

No Splits history available

No Bonus history available

No Rights history available
Quality key factors
Valuation key factors
Technicals key factors
 Technical Indicator Scale: Bearish, Mildly Bearish, Sideways, Mildly Bullish, Bullish Turned
 Shareholding Snapshot : Mar 2026
Shareholding Compare (%holding)
Promoters
None
Held by 2 Schemes (4.54%)
Held by 23 FIIs (0.38%)
Visakhapatnam Port Trust (19.47%)
Life Insurance Corporation Of India (3.92%)
15.41%
Quarterly Results Snapshot (Standalone) - Mar'26 - QoQ

QoQ Growth in quarter ended Mar 2026 is 73.22% vs 30.36% in Dec 2025
QoQ Growth in quarter ended Mar 2026 is 452.86% vs 27.94% in Dec 2025
Half Yearly Results Snapshot (Standalone) - Sep'25
Growth in half year ended Sep 2025 is 27.79% vs -11.66% in Sep 2024
Growth in half year ended Sep 2025 is 11.40% vs -303.29% in Sep 2024
Nine Monthly Results Snapshot (Standalone) - Dec'25
YoY Growth in nine months ended Dec 2025 is 7.41% vs 1.82% in Dec 2024
YoY Growth in nine months ended Dec 2025 is -68.15% vs -182.57% in Dec 2024
Annual Results Snapshot (Standalone) - Mar'26

YoY Growth in year ended Mar 2026 is 5.80% vs 20.80% in Mar 2025
YoY Growth in year ended Mar 2026 is 117.30% vs -182.76% in Mar 2025
About Dredging Corporation of India Ltd

Company Coordinates


