
Compare Dynacons Sys. with Similar Stocks
Stock DNA
Computers - Software & Consulting
INR 1,612 Cr (Micro Cap)
20.00
20
0.04%
0.40
26.88%
5.28
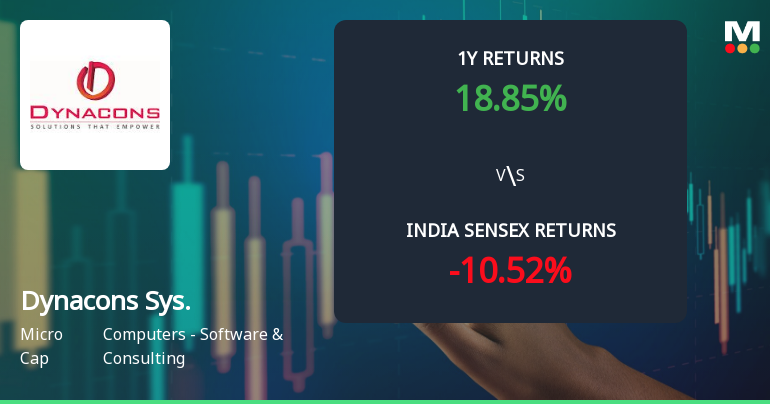
Total Returns (Price + Dividend) 
Latest dividend: 0.5 per share ex-dividend date: Aug-22-2025
Risk Adjusted Returns v/s
Returns Beta

News
Dynacons Systems & Solutions Ltd Technical Momentum Shifts Amid Mixed Market Signals
Dynacons Systems & Solutions Ltd, a micro-cap player in the Computers - Software & Consulting sector, has experienced a notable shift in its technical momentum, moving from a mildly bullish stance to a more confident bullish trend. Despite a recent decline in share price and a downgrade in its Mojo Grade to Sell, the stock’s technical indicators suggest a complex interplay of bullish signals and cautionary notes, reflecting both opportunity and risk for investors.
Read full news article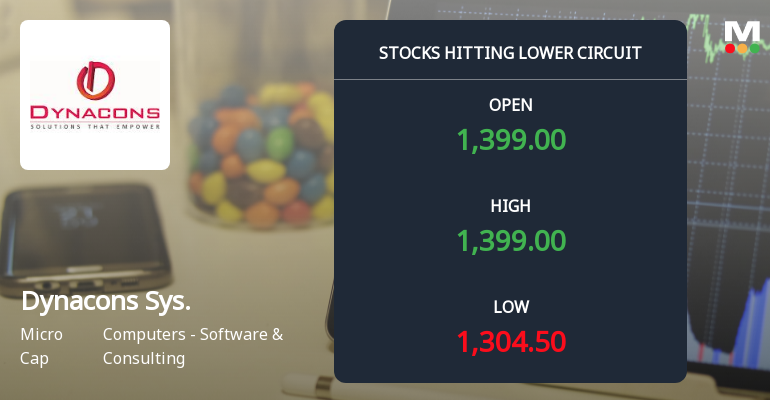
Dynacons Systems & Solutions Ltd Locks at Lower Circuit With 5.0% Loss — Sellers Queue, No Buyers in Sight
At Rs 1306, sellers were still queuing — but there were no buyers willing to take the other side. Dynacons Systems & Solutions Ltd locked at its lower circuit of 5.0% on 11 Jun 2026, with unfilled sell orders and a frozen price, signalling a day dominated by supply overwhelming demand.
Read full news article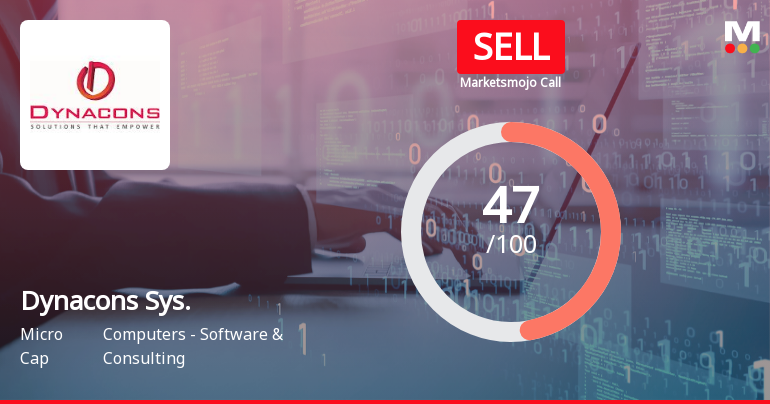
Dynacons Systems & Solutions Ltd Downgraded to Sell Amid Mixed Financial and Technical Signals
Dynacons Systems & Solutions Ltd has seen its investment rating downgraded from Hold to Sell, reflecting a complex interplay of technical, valuation, financial trend, and quality factors. Despite strong long-term returns and solid operational metrics, recent technical signals and valuation adjustments have prompted a more cautious stance from analysts.
Read full news article Announcements
Announcement under Regulation 30 (LODR)-Award_of_Order_Receipt_of_Order
08-Jun-2026 | Source : BSEPlease find enclosed intimation for securing project from Central Bank of India worth Rs 125.88 crores (excluding GST) for expansion of Private cloud establishment of Containerization Platform & Servers based on NVIDIA H200 Blackwell GPUs
Announcement under Regulation 30 (LODR)-Earnings Call Transcript
05-Jun-2026 | Source : BSEPlease find attached Transcript of the Earnings call on the Audited Financial Results (Consolidated and Standalone) for the quarter and year ended on March 31 2026 held on June 02 2026
Announcement under Regulation 30 (LODR)-Press Release / Media Release
04-Jun-2026 | Source : BSEPlease find enclosed announcement titled Dynacons listed in TIMEs Indias Fastest-Growing Companies of 2026.
Corporate Actions

No Upcoming Board Meetings

Dynacons Systems & Solutions Ltd has declared 5% dividend, ex-date: 22 Aug 25

Dynacons Systems & Solutions Ltd has announced 10:1 stock split, ex-date: 03 Nov 11

No Bonus history available

No Rights history available
Quality key factors
Valuation key factors
Technicals key factors
 Technical Indicator Scale: Bearish, Mildly Bearish, Sideways, Mildly Bullish, Bullish Turned
 Shareholding Snapshot : Mar 2026
Shareholding Compare (%holding)
Promoters
None
Held by 0 Schemes
Held by 14 FIIs (0.37%)
Trigem Infosolutions Limited (16.4%)
Niraj Deepak Dalal (1.93%)
34.08%
Quarterly Results Snapshot (Consolidated) - Mar'26 - YoY

YoY Growth in quarter ended Mar 2026 is 22.36% vs 16.57% in Mar 2025

YoY Growth in quarter ended Mar 2026 is 3.96% vs 29.08% in Mar 2025
Half Yearly Results Snapshot (Consolidated) - Sep'25
Growth in half year ended Sep 2025 is 8.60% vs 21.70% in Sep 2024
Growth in half year ended Sep 2025 is 17.94% vs 34.88% in Sep 2024
Nine Monthly Results Snapshot (Consolidated) - Dec'25
YoY Growth in nine months ended Dec 2025 is 8.90% vs 26.41% in Dec 2024
YoY Growth in nine months ended Dec 2025 is 21.35% vs 36.40% in Dec 2024
Annual Results Snapshot (Consolidated) - Mar'26
YoY Growth in year ended Mar 2026 is 12.39% vs 23.70% in Mar 2025
YoY Growth in year ended Mar 2026 is 17.06% vs 34.48% in Mar 2025
About Dynacons Systems & Solutions Ltd

Company Coordinates


