
Compare Dynamic Cables with Similar Stocks
Dashboard
Strong ability to service debt as the company has a low Debt to EBITDA ratio of 0.33 times
The company has declared Positive results for the last 7 consecutive quarters
With ROE of 18.5, it has a Attractive valuation with a 4 Price to Book Value
Increasing Participation by Institutional Investors
Stock DNA
Cables - Electricals
INR 1,808 Cr (Small Cap)
22.00
49
0.00%
-0.03
18.47%
3.73
Total Returns (Price + Dividend) 
Latest dividend: 0.25 per share ex-dividend date: Jun-23-2025
Risk Adjusted Returns v/s
Returns Beta

News

Golden Cross Forms in Dynamic Cables Ltd Amid Mixed Technical Signals and Strong Recent Rally
The 50-day moving average has crossed above the 200-day moving average for Dynamic Cables Ltd, signalling a golden cross on 25 Jun 2026. Yet, the broader technical picture is nuanced, with monthly indicators showing mild bearishness despite strong weekly momentum. This divergence raises questions about the strength and reliability of the signal in the current context.
Read full news article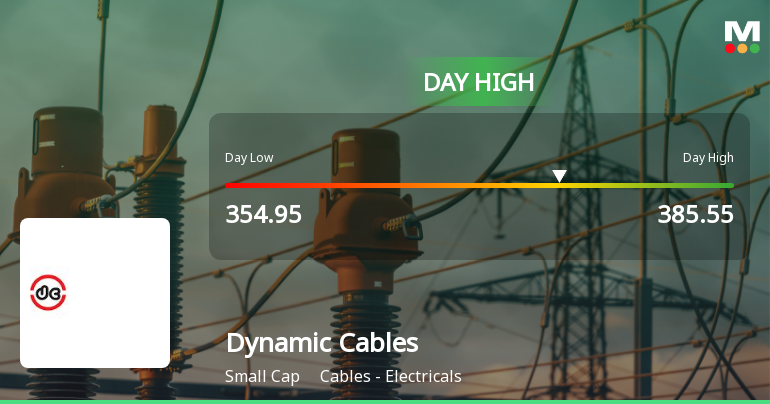
Dynamic Cables Ltd Surges 7.35% to Day's High of Rs 385.55 — Outperforms Sector by 7.64 Percentage Points
The Sensex advanced 0.67% on 25 Jun 2026, yet Dynamic Cables Ltd outpaced the broader market with a 7.35% gain, touching an intraday high of Rs 385.55. This 7.64-percentage-point outperformance over its sector signals a distinctly stock-specific rally rather than a market-wide lift.
Read full news article
Dynamic Cables Ltd Technical Momentum Shifts Amid Mixed Market Signals
Dynamic Cables Ltd has experienced a notable shift in its technical momentum, moving from a sideways trend to a mildly bearish stance. Despite a recent downgrade in daily moving averages and a slight dip in price, several weekly and monthly indicators present a complex picture, signalling both bullish and bearish tendencies. This nuanced technical landscape warrants a detailed analysis for investors seeking clarity on the stock’s near-term trajectory.
Read full news article Announcements
Corporate Actions

No Upcoming Board Meetings

Dynamic Cables Ltd has declared 5% dividend, ex-date: 10 Jul 26

No Splits history available

Dynamic Cables Ltd has announced 1:1 bonus issue, ex-date: 11 Jul 25

No Rights history available
Quality key factors
Valuation key factors
Technicals key factors
 Technical Indicator Scale: Bearish, Mildly Bearish, Sideways, Mildly Bullish, Bullish Turned
 Shareholding Snapshot : Mar 2026
Shareholding Compare (%holding)
Promoters
None
Held by 0 Schemes
Held by 4 FIIs (0.9%)
Ashish Mangal (31.81%)
None
25.91%
Quarterly Results Snapshot (Standalone) - Mar'26 - YoY

YoY Growth in quarter ended Mar 2026 is 7.33% vs 37.47% in Mar 2025
YoY Growth in quarter ended Mar 2026 is 2.59% vs 71.10% in Mar 2025
Half Yearly Results Snapshot (Standalone) - Sep'25
Growth in half year ended Sep 2025 is 22.79% vs 32.23% in Sep 2024
Growth in half year ended Sep 2025 is 48.68% vs 54.52% in Sep 2024
Nine Monthly Results Snapshot (Standalone) - Dec'25
YoY Growth in nine months ended Dec 2025 is 21.34% vs 31.70% in Dec 2024
YoY Growth in nine months ended Dec 2025 is 46.08% vs 71.95% in Dec 2024
Annual Results Snapshot (Standalone) - Mar'26
YoY Growth in year ended Mar 2026 is 16.82% vs 33.51% in Mar 2025
YoY Growth in year ended Mar 2026 is 30.27% vs 71.62% in Mar 2025
About Dynamic Cables Ltd

Company Coordinates


