
Compare Universal Cables with Similar Stocks
Dashboard
Low ability to service debt as the company has a high Debt to EBITDA ratio of 4.52 times
- Low ability to service debt as the company has a high Debt to EBITDA ratio of 4.52 times
- The company has been able to generate a Return on Equity (avg) of 6.69% signifying low profitability per unit of shareholders funds
Healthy long term growth as Operating profit has grown by an annual rate 28.02%
The company has declared Positive results for the last 4 consecutive quarters
With ROCE of 7.2, it has a Attractive valuation with a 1.8 Enterprise value to Capital Employed
Majority shareholders : Promoters
Market Beating performance in long term as well as near term
Stock DNA
Cables - Electricals
INR 4,405 Cr (Small Cap)
26.00
49
0.31%
0.62
8.63%
2.38
Total Returns (Price + Dividend) 
Latest dividend: 4 per share ex-dividend date: Sep-04-2025
Risk Adjusted Returns v/s
Returns Beta

News
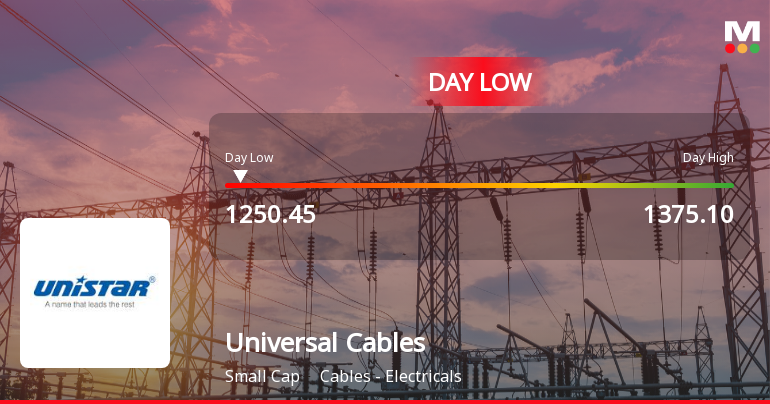
Universal Cables Ltd. Hits Intraday Low Amid Price Pressure on 23 Jun 2026
Universal Cables Ltd. experienced a notable intraday decline on 23 Jun 2026, with its stock price touching a low of Rs 1,253, reflecting a sharp fall of 7.16% during the trading session. This downturn occurred amid broader market weakness and heightened volatility, marking a reversal after two consecutive days of gains.
Read full news article
Universal Cables Ltd. Downgraded to Hold Amid Valuation Concerns Despite Strong Financials
Universal Cables Ltd., a prominent player in the electrical cables sector, has seen its investment rating downgraded from Buy to Hold as of 22 June 2026. This revision primarily stems from a reassessment of the company’s valuation metrics, despite robust financial performance and encouraging technical indicators. The new rating reflects a more cautious stance amid fair valuation levels and moderate profitability ratios, signalling a nuanced outlook for investors.
Read full news article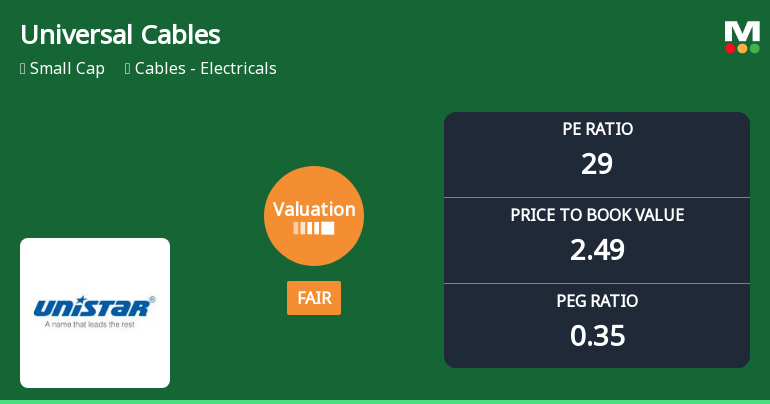
Universal Cables Ltd: Valuation Shifts Signal Changing Price Attractiveness
Universal Cables Ltd., a prominent player in the electrical cables sector, has witnessed a notable shift in its valuation parameters, moving from an attractive to a fair rating. This change comes alongside a strong price rally that has significantly outpaced the broader market, prompting investors to reassess the stock’s price attractiveness relative to its historical and peer benchmarks.
Read full news article Announcements
Universal Cables Limited - Reply to Clarification- Financial results
14-Nov-2019 | Source : NSEUniversal Cables Limitediversal Cables Limited for the quarter ended 30-Jun-2019 with respect to Regulation 33 of the SEBI (Listing Obligations and Disclosure Requirements) Regulations, 2015.
Universal Cables Limited - Updates
04-Nov-2019 | Source : NSEUniversal Cables Limited has informed the Exchange regarding 'Newspaper advertisement pursuant to Regulation 47 and Regulation 30 of SEBI (Listing Obligation and Disclosure Requirements) Regulations, 2015'.
Clarification - Financial Results
19-Aug-2019 | Source : NSE
| The Exchange has sought clarification from Universal Cables Limited for the quarter ended 30-Jun-2019 with respect to Regulation 33 of the SEBI (Listing Obligations and Disclosure Requirements) Regulations, 2015. On basis of above the Company is required to clarify the following: -1. Consolidated Financial Results not submitted The response of the Company is awaited. |
Corporate Actions

No Upcoming Board Meetings

Universal Cables Ltd. has declared 40% dividend, ex-date: 04 Sep 25

No Splits history available

No Bonus history available

Universal Cables Ltd. has announced 1:2 rights issue, ex-date: 16 Sep 15
Quality key factors
Valuation key factors
Technicals key factors
 Technical Indicator Scale: Bearish, Mildly Bearish, Sideways, Mildly Bullish, Bullish Turned
 Shareholding Snapshot : Mar 2026
Shareholding Compare (%holding)
Promoters
None
Held by 2 Schemes (2.79%)
Held by 27 FIIs (0.68%)
Vindhya Telelinks Limited (23.85%)
Eastern India Educational Institution (3.18%)
14.44%
Quarterly Results Snapshot (Consolidated) - Mar'26 - YoY

YoY Growth in quarter ended Mar 2026 is 24.66% vs 16.15% in Mar 2025
YoY Growth in quarter ended Mar 2026 is 11.33% vs 2.31% in Mar 2025
Half Yearly Results Snapshot (Consolidated) - Sep'25
Growth in half year ended Sep 2025 is 25.53% vs 15.71% in Sep 2024
Growth in half year ended Sep 2025 is 237.62% vs -33.14% in Sep 2024
Nine Monthly Results Snapshot (Consolidated) - Dec'25
YoY Growth in nine months ended Dec 2025 is 25.83% vs 20.41% in Dec 2024
YoY Growth in nine months ended Dec 2025 is 171.49% vs -33.46% in Dec 2024
Annual Results Snapshot (Consolidated) - Mar'26
YoY Growth in year ended Mar 2026 is 25.51% vs 19.19% in Mar 2025
YoY Growth in year ended Mar 2026 is 82.47% vs -17.40% in Mar 2025
About Universal Cables Ltd.

Company Coordinates


