
Compare E-Land Apparel with Similar Stocks
Dashboard
With a Negative Book Value, the company has a Weak Long Term Fundamental Strength
- Poor long term growth as Net Sales has grown by an annual rate of 16.58% and Operating profit at 0% over the last 5 years
- The company has a negative book value of Rs 509.28 crore
The company has declared Negative results for the last 3 consecutive quarters
Risky - Negative EBITDA
Underperformed the market in the last 1 year
Stock DNA
Garments & Apparels
INR 65 Cr (Micro Cap)
NA (Loss Making)
23
0.00%
-0.33
9.20%
-0.13
Total Returns (Price + Dividend) 
Latest dividend: 0.4500 per share ex-dividend date: Sep-24-2010
Risk Adjusted Returns v/s
Returns Beta

News
Are E-Land Apparel Ltd latest results good or bad?
E-Land Apparel Ltd's latest financial results for Q4 FY26 present a challenging picture. The company reported a net loss of ₹10.33 crores, a stark contrast to a profit of ₹7.01 crores in the same quarter last year. This shift highlights a significant deterioration in profitability. Revenue for the quarter was ₹88.55 crores, reflecting a 34.19% sequential increase from the previous quarter but a year-on-year decline of 14.49% compared to ₹103.56 crores in Q4 FY25. This indicates ongoing struggles to maintain market share amidst competitive pressures. The operating margin turned negative at -1.06%, a notable decline from the positive margin of 4.16% in Q4 FY25, driven by rising employee costs that outpaced revenue growth. Additionally, the interest burden increased significantly, with finance costs rising to ₹4.88 crores, marking an 81.41% year-on-year increase. This financial strain has contributed to a pre...
Read full news article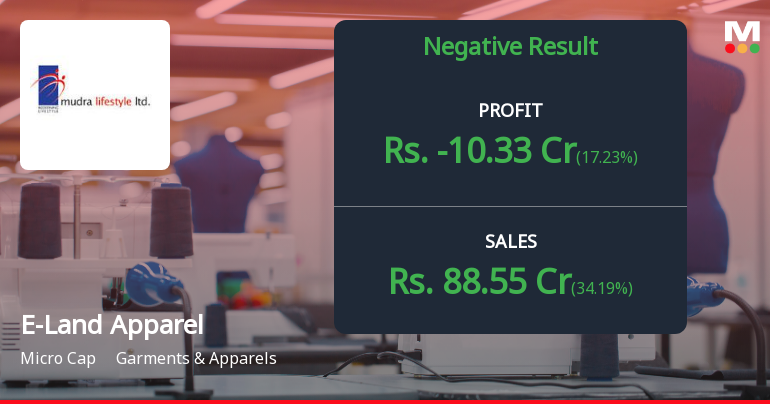
E-Land Apparel Q4 FY26: Mounting Losses Signal Deepening Crisis
E-Land Apparel Ltd., a micro-cap garments and apparels manufacturer, reported a staggering net loss of ₹10.33 crores for Q4 FY26, marking a sharp deterioration from the ₹7.01 crores profit posted in the same quarter last year. The Mumbai-based company's fourth consecutive quarter of losses underscores mounting operational challenges that have eroded shareholder value, with the stock trading at ₹14.00—a 56.62% decline from its 52-week high of ₹32.27.
Read full news article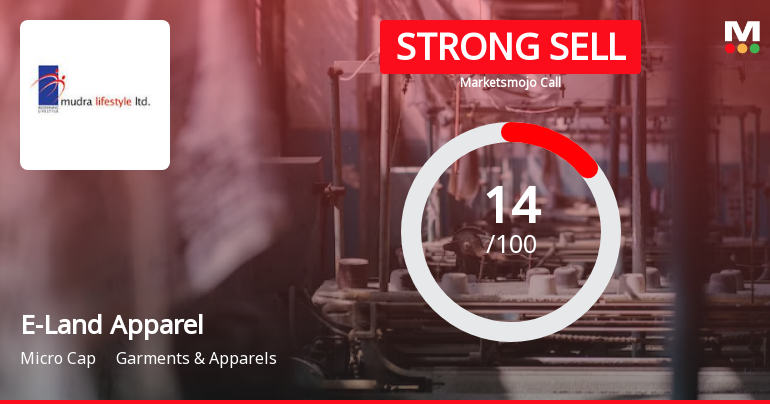
E-Land Apparel Ltd is Rated Strong Sell
E-Land Apparel Ltd is rated Strong Sell by MarketsMOJO. This rating was last updated on 13 Nov 2025, reflecting a reassessment of the company’s outlook. However, the analysis below presents the stock’s current position as of 29 May 2026, incorporating the latest fundamentals, returns, and financial metrics to provide investors with an up-to-date perspective.
Read full news article Announcements
Announcement under Regulation 30 (LODR)-Newspaper Publication
31-May-2026 | Source : BSEPlease find attached Newspaper publication of extract of Audited financial results for the quarter and year ended 31 March 2026.
Announcement under Regulation 30 (LODR)-Change in Management
29-May-2026 | Source : BSEAppointment of Internal Auditors
Compliances-Reg.24(A)-Annual Secretarial Compliance
29-May-2026 | Source : BSEAnnual Secretarial Compliance Report for the Financial year ended March 31 2026.
Corporate Actions

No Upcoming Board Meetings

E-Land Apparel Ltd has declared 6% dividend, ex-date: 24 Sep 10

No Splits history available

No Bonus history available

No Rights history available
Quality key factors
Valuation key factors
Technicals key factors
 Technical Indicator Scale: Bearish, Mildly Bearish, Sideways, Mildly Bullish, Bullish Turned
 Shareholding Snapshot : Mar 2026
Shareholding Compare (%holding)
Promoters
None
Held by 0 Schemes
Held by 0 FIIs
E-land Asia Holdings Pte Ltd (65.84%)
Vikram Sharad Sheth (2.39%)
26.46%
Quarterly Results Snapshot (Standalone) - Mar'26 - QoQ

QoQ Growth in quarter ended Mar 2026 is 34.19% vs 95.53% in Dec 2025
QoQ Growth in quarter ended Mar 2026 is 17.23% vs 35.80% in Dec 2025
Half Yearly Results Snapshot (Standalone) - Sep'25
Growth in half year ended Sep 2025 is -17.85% vs 28.82% in Sep 2024
Growth in half year ended Sep 2025 is -794.05% vs 119.99% in Sep 2024
Nine Monthly Results Snapshot (Standalone) - Dec'25
YoY Growth in nine months ended Dec 2025 is -12.39% vs 41.75% in Dec 2024
YoY Growth in nine months ended Dec 2025 is -655.26% vs 120.89% in Dec 2024
Annual Results Snapshot (Standalone) - Mar'26
YoY Growth in year ended Mar 2026 is -13.11% vs 39.46% in Mar 2025
YoY Growth in year ended Mar 2026 is -446.34% vs 134.30% in Mar 2025
About E-Land Apparel Ltd

Company Coordinates


