
Compare Eldeco Housing with Similar Stocks
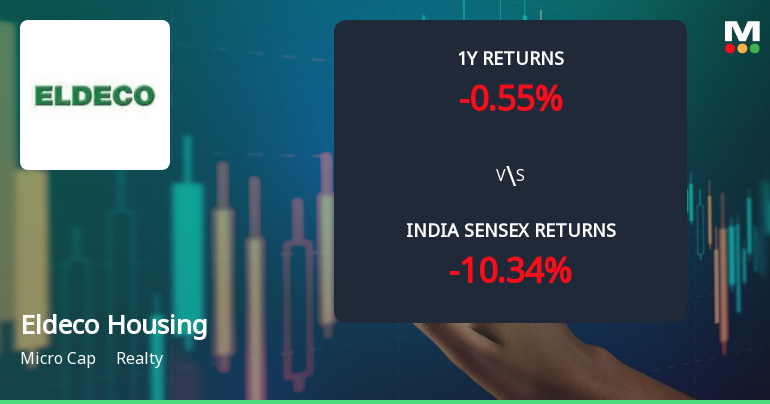
Total Returns (Price + Dividend) 
Latest dividend: 9 per share ex-dividend date: Sep-18-2025
Risk Adjusted Returns v/s
Returns Beta

News
Eldeco Housing & Industries Ltd Sees Mixed Technical Signals Amid Price Momentum Shift
Eldeco Housing & Industries Ltd, a micro-cap player in the realty sector, has experienced a notable shift in price momentum and technical indicators, prompting a downgrade in its Mojo Grade from Hold to Sell. Despite a strong intraday rally pushing the stock price to ₹819.80, the overall technical landscape remains cautiously bearish, reflecting mixed signals across key momentum and trend indicators.
Read full news article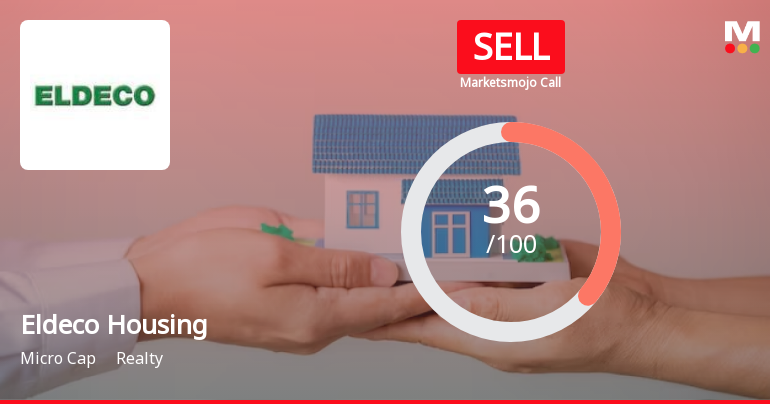
Eldeco Housing & Industries Ltd is Rated Sell
Eldeco Housing & Industries Ltd is rated 'Sell' by MarketsMOJO, with this rating last updated on 26 May 2026. However, the analysis and financial metrics discussed here reflect the stock's current position as of 09 June 2026, providing investors with the most up-to-date perspective on the company’s fundamentals, valuation, financial trends, and technical outlook.
Read full news article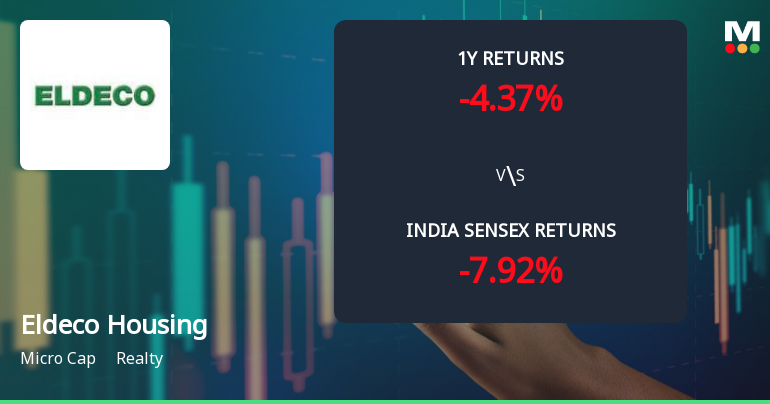
Eldeco Housing & Industries Ltd Technical Momentum Shifts Amid Mixed Market Signals
Eldeco Housing & Industries Ltd has experienced a subtle shift in its technical momentum, moving from a bearish to a mildly bearish trend as of early June 2026. Despite a modest day gain of 2.45%, the micro-cap realty stock faces a challenging outlook with a MarketsMOJO Mojo Score of 41.0 and a recent downgrade from Hold to Sell. This article analyses the key technical indicators shaping the stock’s near-term trajectory and contextualises its performance against broader market benchmarks.
Read full news article Announcements
Corporate Actions

No Upcoming Board Meetings

Eldeco Housing & Industries Ltd has declared 450% dividend, ex-date: 18 Sep 25

Eldeco Housing & Industries Ltd has announced 2:10 stock split, ex-date: 17 Jan 22

No Bonus history available

No Rights history available
Quality key factors
Valuation key factors
Technicals key factors
 Technical Indicator Scale: Bearish, Mildly Bearish, Sideways, Mildly Bullish, Bullish Turned
 Shareholding Snapshot : Mar 2026
Shareholding Compare (%holding)
Promoters
None
Held by 0 Schemes
Held by 2 FIIs (0.82%)
Pankaj Bajaj (34.32%)
Guardian Advisors Private Limited (8%)
17.2%
Quarterly Results Snapshot (Consolidated) - Mar'26 - QoQ

QoQ Growth in quarter ended Mar 2026 is 39.53% vs 30.35% in Dec 2025

QoQ Growth in quarter ended Mar 2026 is -64.52% vs 419.77% in Dec 2025
Half Yearly Results Snapshot (Consolidated) - Sep'25
Growth in half year ended Sep 2025 is -1.31% vs 49.34% in Sep 2024
Growth in half year ended Sep 2025 is -53.84% vs -10.97% in Sep 2024
Nine Monthly Results Snapshot (Consolidated) - Dec'25
YoY Growth in nine months ended Dec 2025 is 7.82% vs 53.10% in Dec 2024
YoY Growth in nine months ended Dec 2025 is 6.40% vs -17.55% in Dec 2024
Annual Results Snapshot (Consolidated) - Mar'26
YoY Growth in year ended Mar 2026 is 23.14% vs 18.85% in Mar 2025
YoY Growth in year ended Mar 2026 is 12.88% vs -36.47% in Mar 2025
About Eldeco Housing & Industries Ltd

Company Coordinates


