
Compare Electrotherm(I) with Similar Stocks
Dashboard
With a Negative Book Value, the company has a Weak Long Term Fundamental Strength
- Poor long term growth as Net Sales has grown by an annual rate of 8.01% and Operating profit at 0% over the last 5 years
- The company has a negative book value of Rs 153.88 crore
The company has declared Negative results for the last 7 consecutive quarters
Risky - Negative Operating Profits
Despite the size of the company, domestic mutual funds hold only 0.11% of the company
Underperformed the market in the last 1 year
Stock DNA
Iron & Steel Products
INR 1,388 Cr (Micro Cap)
NA (Loss Making)
39
0.00%
-6.32
13.01%
-8.76
Total Returns (Price + Dividend) 
Latest dividend: 2.5 per share ex-dividend date: Sep-16-2010
Risk Adjusted Returns v/s
Returns Beta

News
Electrotherm (India) Ltd Upgraded to Sell Amid Mixed Technicals and Weak Fundamentals
Electrotherm (India) Ltd has seen its investment rating upgraded from Strong Sell to Sell as of 22 June 2026, driven primarily by improvements in technical indicators despite persistent fundamental weaknesses. The company’s micro-cap status and challenging financial trends continue to weigh on investor sentiment, but recent bullish technical signals have prompted a reassessment of its near-term outlook.
Read full news article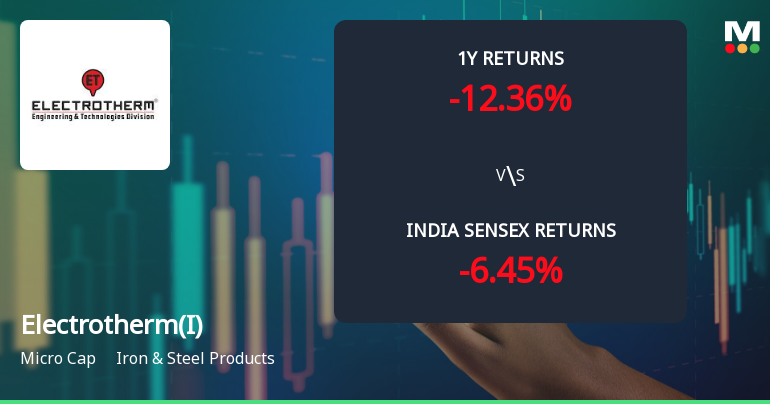
Electrotherm (India) Ltd Technical Momentum Shifts Amid Mixed Market Signals
Electrotherm (India) Ltd, a micro-cap player in the Iron & Steel Products sector, has experienced a notable shift in its technical momentum, moving from a mildly bullish to a bullish trend. Despite a recent day decline of 1.44% to close at ₹1,058.30, the stock’s technical indicators reveal a complex but predominantly positive outlook, suggesting potential opportunities for investors willing to navigate its nuanced signals.
Read full news article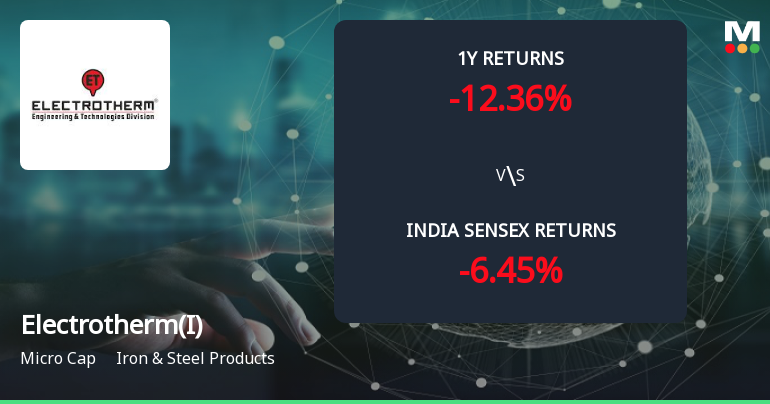
Golden Cross Forms in Electrotherm (India) Ltd — On a Day the Stock Fell 1.44%. What the Mixed Signals Mean
The 50-day moving average has crossed above the 200-day moving average for Electrotherm (India) Ltd, signalling a golden cross on 22 Jun 2026. Yet, the stock declined 1.44% on the same day, while monthly momentum indicators remain mildly bearish. This juxtaposition of signals calls for a detailed examination of the technical and fundamental context to assess the reliability of this crossover.
Read full news article Announcements
Clarification On Price Movement
03-Jun-2026 | Source : BSEClarification on Price Movement
Clarification sought from Electrotherm (India) Ltd
03-Jun-2026 | Source : BSEThe Exchange has sought clarification from Electrotherm (India) Ltd on June 3 2026 with reference to significant movement in price in order to ensure that investors have latest relevant information about the company and to inform the market so that the interest of the investors is safeguarded.
The reply is awaited.
Announcement under Regulation 30 (LODR)-Newspaper Publication
22-May-2026 | Source : BSENewspaper publication of Audited financial results for the quarter and year ended on 31st March 2026
Corporate Actions

No Upcoming Board Meetings

Electrotherm (India) Ltd has declared 25% dividend, ex-date: 16 Sep 10

No Splits history available

No Bonus history available

No Rights history available
Quality key factors
Valuation key factors
Technicals key factors
 Technical Indicator Scale: Bearish, Mildly Bearish, Sideways, Mildly Bullish, Bullish Turned
 Shareholding Snapshot : Mar 2026
Shareholding Compare (%holding)
Non Institution
7.8725
Held by 2 Schemes (0.08%)
Held by 11 FIIs (5.86%)
Western India Speciality Hospital Limited (7.65%)
Leadhaven Pte Limited (7.85%)
28.58%
Quarterly Results Snapshot (Consolidated) - Mar'26 - YoY

YoY Growth in quarter ended Mar 2026 is -1.82% vs -4.64% in Mar 2025

YoY Growth in quarter ended Mar 2026 is -92.65% vs 78.31% in Mar 2025
Half Yearly Results Snapshot (Consolidated) - Sep'25
Growth in half year ended Sep 2025 is -12.00% vs -2.27% in Sep 2024
Growth in half year ended Sep 2025 is -96.36% vs 58.45% in Sep 2024
Nine Monthly Results Snapshot (Consolidated) - Dec'25
YoY Growth in nine months ended Dec 2025 is -13.61% vs -3.26% in Dec 2024
YoY Growth in nine months ended Dec 2025 is -111.41% vs 20.32% in Dec 2024
Annual Results Snapshot (Consolidated) - Mar'26
YoY Growth in year ended Mar 2026 is -10.29% vs -3.66% in Mar 2025
YoY Growth in year ended Mar 2026 is -103.54% vs 39.33% in Mar 2025
About Electrotherm (India) Ltd

Company Coordinates


