
Dashboard
With ROCE of 9.5, it has a Very Expensive valuation with a 7.3 Enterprise value to Capital Employed
- The stock is trading at a premium compared to its peers' average historical valuations
- Over the past year, while the stock has generated a return of -47.56%, its profits have fallen by 0%
Below par performance in long term as well as near term
Stock DNA
Trading & Distributors
INR 4,856 Cr (Small Cap)
15.00
21
0.16%
1.06
20.14%
14.05
Total Returns (Price + Dividend) 
Latest dividend: 0.05 per share ex-dividend date: Nov-12-2025
Risk Adjusted Returns v/s
Returns Beta

News
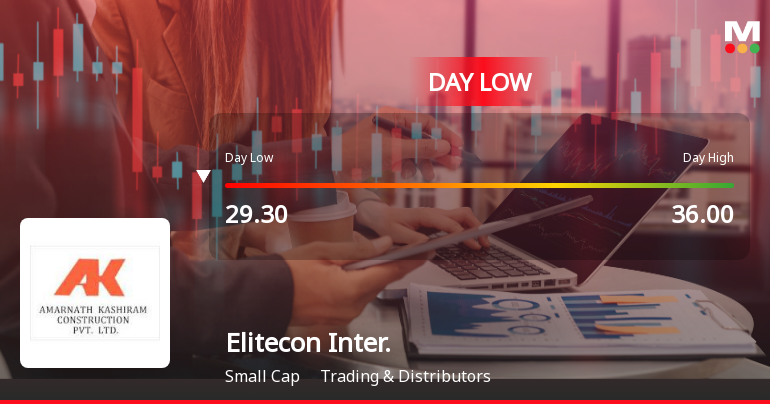
Elitecon International Ltd Hits Intraday Low Amid Price Pressure on 11 June 2026
Elitecon International Ltd experienced a significant intraday decline on 11 Jun 2026, touching a low of Rs 29.5, down 8.7% from the previous close, reflecting notable price pressure amid a volatile trading session.
Read full news article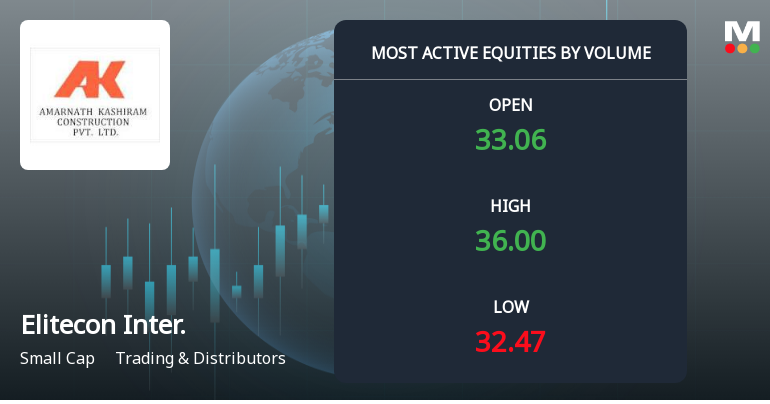
Elitecon International Ltd Sees Exceptional Volume Surge Amid Strong Price Gains
Elitecon International Ltd, a small-cap player in the Trading & Distributors sector, has witnessed a remarkable surge in trading volume and price performance, outpacing its sector and broader market indices. The stock’s recent activity signals heightened investor interest and potential accumulation, despite a recent downgrade in its Mojo Grade to Sell.
Read full news article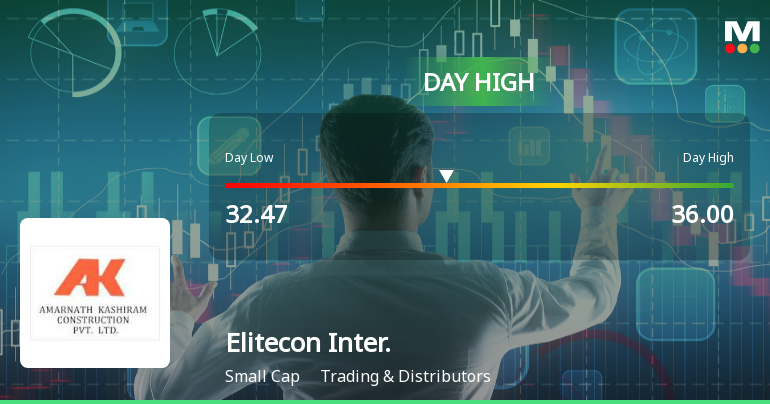
Elitecon International Ltd Surges 8.48% to Day's High of Rs 35.5 — Outperforms Sector by 9.96 Percentage Points
The Sensex declined by 0.46% on 11 Jun 2026, while Elitecon International Ltd surged 8.48%, marking a remarkable 9.96 percentage-point outperformance over its Trading & Distributors sector. This sharp single-session gain rewrites the short-term narrative for the stock, which has been on a three-day winning streak, accumulating a 32.21% return in that period.
Read full news article Announcements
Announcement under Regulation 30 (LODR)-Press Release / Media Release
10-Jun-2026 | Source : BSEPursuant to Regulation 30 of the SEBI (Listing Obligations and Disclosure Requirements) Regulations 2015 and in continuation of the Companys earlier disclosure dated April 29 2026 please find enclosed herewith a Company Update/ Press Release titled Elitecon International Announces Rs. 700 Crore FMCG Expansion Roadmap Targets Rs. 20000 Crore Revenues by FY 30. The enclosed press release is self explanatory. You are requested to kindly take the same on record.
Announcement Under Reg 30 (LODR) - Appointment Of Forensic Auditor
20-May-2026 | Source : BSEAnnouncement under Reg 30 (LODR) - Appointment of Forensic Auditor
Announcement under Regulation 30 (LODR)-Change in Management
29-Apr-2026 | Source : BSE1. Appointment of Mr. Kumar Anubhav Upadhyay (DIN: 09519842) as an Executive Additional Director in the Company w.e.f. Wednesday April 29 2026. 2. Resignation of Mr. Vipin Sharma (DIN: 01739519) from the position of Managing Director of the Company w.e.f. Wednesday April 29 2026.
Corporate Actions

No Upcoming Board Meetings

Elitecon International Ltd has declared 5% dividend, ex-date: 12 Nov 25

Elitecon International Ltd has announced 1:10 stock split, ex-date: 25 Jun 25

No Bonus history available

No Rights history available
Quality key factors
Valuation key factors
Technicals key factors
 Technical Indicator Scale: Bearish, Mildly Bearish, Sideways, Mildly Bullish, Bullish Turned
 Shareholding Snapshot : Mar 2026
Shareholding Compare (%holding)
Promoters
None
Held by 0 Schemes
Held by 18 FIIs (38.04%)
Pandokhar Food Llp (24.71%)
Minerva Ventures Fund (8.67%)
2.07%
Quarterly Results Snapshot (Standalone) - Dec'25 - YoY

YoY Growth in quarter ended Dec 2025 is 938.70% vs 392.37% in Dec 2024

YoY Growth in quarter ended Dec 2025 is 44.11% vs 2,858.33% in Dec 2024
Half Yearly Results Snapshot (Consolidated) - Sep'25
Not Applicable: The company has declared_date for only one period
Not Applicable: The company has declared_date for only one period
Nine Monthly Results Snapshot (Consolidated) - Dec'25
Not Applicable: The company has declared_date for only one period
Not Applicable: The company has declared_date for only one period
Annual Results Snapshot (Consolidated) - Mar'25
Not Applicable: The company has declared_date for only one period
Not Applicable: The company has declared_date for only one period
About Elitecon International Ltd

Company Coordinates


