
Compare Emmvee Photovol. with Similar Stocks
Dashboard
Strong Long Term Fundamental Strength with an average Return on Equity (ROE) of 0%
- Healthy long term growth as Net Sales has grown by an annual rate of 0% and Operating profit at 0%
- The company is Net-Debt Free
With a growth in Net Sales of 234.8%, the company declared Outstanding results in Mar 26
Company is among the highest 1% of companies rated by MarketsMojo across all 4,000 stocks
Stock DNA
Other Electrical Equipment
INR 22,989 Cr (Small Cap)
21.00
56
0.00%
-0.01
29.27%
6.21
Total Returns (Price + Dividend) 
Emmvee Photovol. for the last several years.
Risk Adjusted Returns v/s
Returns Beta

News
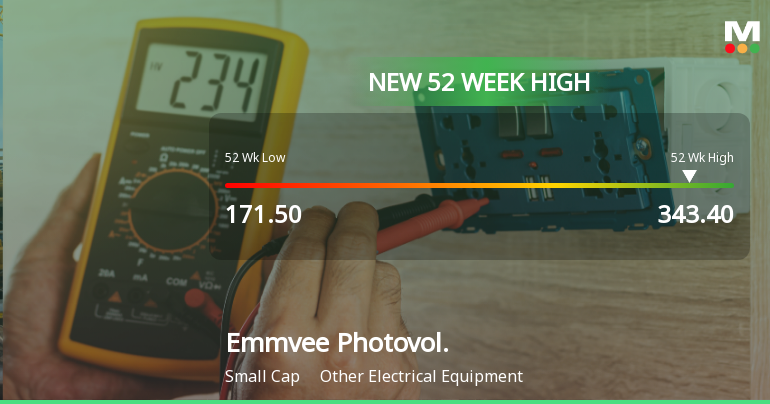
Broad-Based Technical Strength Lifts Emmvee Photovoltaic Power Ltd to 52-Week High of Rs 343.4
With a decisive intraday surge pushing Emmvee Photovoltaic Power Ltd to a fresh 52-week and all-time high of Rs 343.4 on 9 Jun 2026, the stock has demonstrated remarkable price momentum despite a modest pullback in the last two sessions.
Read full news article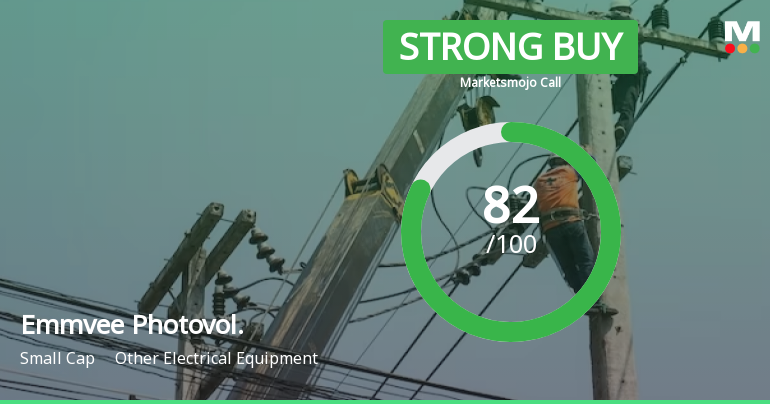
Emmvee Photovoltaic Power Ltd is Rated Strong Buy
Emmvee Photovoltaic Power Ltd is rated Strong Buy by MarketsMOJO, with this rating last updated on 14 May 2026. However, the analysis and financial metrics presented here reflect the stock’s current position as of 08 June 2026, providing investors with the most up-to-date view of the company’s fundamentals, returns, and technical outlook.
Read full news article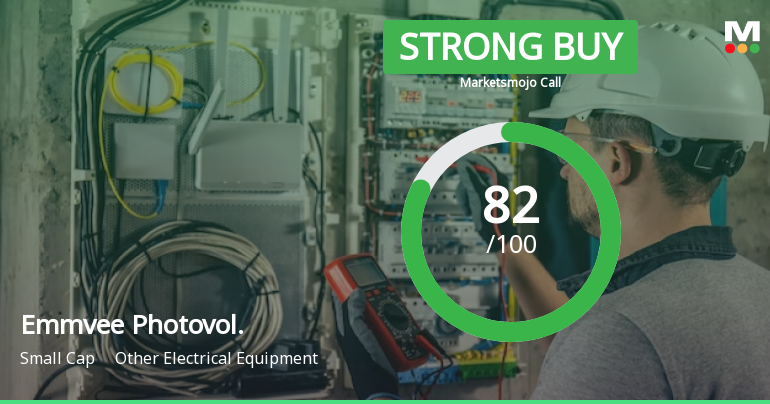
Emmvee Photovoltaic Power Ltd is Rated Strong Buy
Emmvee Photovoltaic Power Ltd is rated Strong Buy by MarketsMOJO, with this rating last updated on 14 May 2026. However, the analysis and financial metrics presented here reflect the stock’s current position as of 08 June 2026, providing investors with the latest insights into the company’s performance and outlook.
Read full news article Announcements
Announcement under Regulation 30 (LODR)-Analyst / Investor Meet - Intimation
29-May-2026 | Source : BSESchedule of interaction with Sell side brokers and investors as mentioned in the intimation.
Announcement under Regulation 30 (LODR)-Analyst / Investor Meet - Intimation
18-May-2026 | Source : BSEPursuant to Regulation 30 of the SEBI (Listing Obligations and Disclosure Requirements) Regulations 2015 we would like to inform you that the Company will be participating in investors/ analysts meetings on 26th and 27th May 2026.
Announcement under Regulation 30 (LODR)-Monitoring Agency Report
13-May-2026 | Source : BSEMonitoring Agency Report for the quarter ended March 31 2026 on the utilisation of proceeds raised through issuance of Equity Shares by way of public issue.
Corporate Actions

No Upcoming Board Meetings

No Dividend history available

No Splits history available

No Bonus history available

No Rights history available
Quality key factors
Valuation key factors
Technicals key factors
 Technical Indicator Scale: Bearish, Mildly Bearish, Sideways, Mildly Bullish, Bullish Turned
 Shareholding Snapshot : Mar 2026
Shareholding Compare (%holding)
Promoters
None
Held by 20 Schemes (7.59%)
Held by 25 FIIs (2.45%)
Shubha Manjunatha Donthi (38.46%)
Icici Prudential Mf Mutual Fund Through Various Schemes (2.59%)
3.87%
Quarterly Results Snapshot (Standalone) - Mar'26 - QoQ

QoQ Growth in quarter ended Mar 2026 is 234.80% vs -70.70% in Dec 2025
QoQ Growth in quarter ended Mar 2026 is 107.48% vs -35.62% in Dec 2025
Half Yearly Results Snapshot (Standalone) - Sep'25
Not Applicable: The company has declared_date for only one period
Not Applicable: The company has declared_date for only one period
Nine Monthly Results Snapshot (Standalone) - Dec'25
Not Applicable: The company has declared_date for only one period
Not Applicable: The company has declared_date for only one period
Annual Results Snapshot (Consolidated) - Mar'26

YoY Growth in year ended Mar 2026 is 116.21% vs 145.35% in Mar 2025
YoY Growth in year ended Mar 2026 is 193.10% vs 1,176.85% in Mar 2025
About Emmvee Photovoltaic Power Ltd

Company Coordinates


