
Compare Enkei Wheels with Similar Stocks
Dashboard
Poor Management Efficiency with a low ROCE of 4.09%
- The company has been able to generate a Return on Capital Employed (avg) of 4.09% signifying low profitability per unit of total capital (equity and debt)
Low ability to service debt as the company has a high Debt to EBITDA ratio of 4.28 times
With ROCE of 1, it has a Expensive valuation with a 2.1 Enterprise value to Capital Employed
Despite the size of the company, domestic mutual funds hold only 0% of the company
Stock DNA
Auto Components & Equipments
INR 719 Cr (Micro Cap)
53.00
37
0.00%
0.85
5.69%
3.00
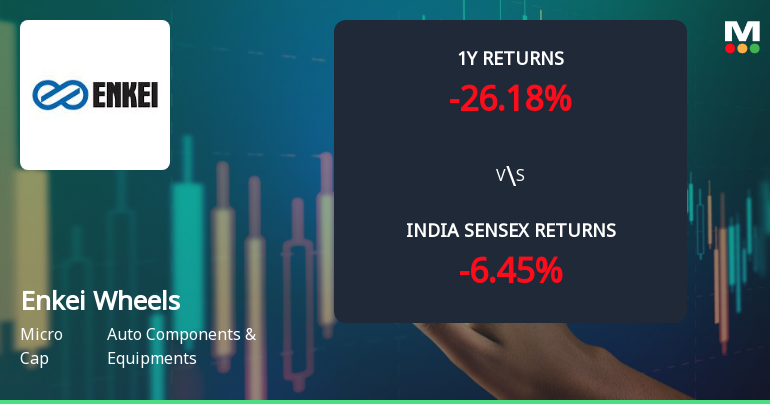
Total Returns (Price + Dividend) 
Enkei Wheels for the last several years.
Risk Adjusted Returns v/s
Returns Beta

News
Enkei Wheels India Ltd Technical Momentum Shifts Amid Mixed Market Signals
Enkei Wheels India Ltd, a micro-cap player in the Auto Components & Equipments sector, has experienced a nuanced shift in its technical momentum, moving from a bearish to a mildly bearish trend. Despite a stagnant day change at ₹400.10, the stock’s technical indicators reveal a complex interplay of bullish and bearish signals, underscoring the challenges faced by investors in navigating its price trajectory amid broader market pressures.
Read full news article
Enkei Wheels India Ltd is Rated Sell by MarketsMOJO
Enkei Wheels India Ltd is rated 'Sell' by MarketsMOJO, with this rating last updated on 02 Mar 2026. However, the analysis and financial metrics discussed here reflect the stock's current position as of 21 June 2026, providing investors with an up-to-date view of the company’s fundamentals, valuation, financial trend, and technical outlook.
Read full news article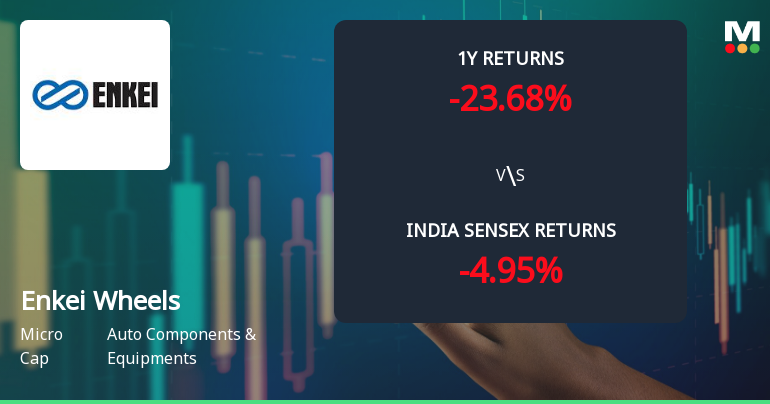
Enkei Wheels India Ltd Faces Bearish Momentum Amid Technical Indicator Shifts
Enkei Wheels India Ltd has experienced a notable shift in its technical momentum, moving from a mildly bearish stance to a more pronounced bearish trend. Despite some mildly bullish weekly signals, the overall technical indicators suggest caution for investors as the stock struggles to regain upward momentum amid a challenging market environment.
Read full news article Announcements
Announcement under Regulation 30 (LODR)-Newspaper Publication
14-May-2026 | Source : BSEPlease find the attached News Paper publication of unaudited Financial Result for the quarter ended on 31st March 2026
Board Meeting Outcome for Quarterly Unaudited Financial Result For The Quarter Ended On 31St March 2026
12-May-2026 | Source : BSEPlease find the attached Unaudited Financial Result for the Quarter ended on 31st March 2026
Result- Unaudited Financial Result For The Quarter Ended On 31St March 2026
12-May-2026 | Source : BSEPlease find the attached Unaudited Financial result for the Quarter Ended on 31st March 2026
Corporate Actions

No Upcoming Board Meetings

No Dividend history available

No Splits history available

No Bonus history available

No Rights history available
Quality key factors
Valuation key factors
Technicals key factors
 Technical Indicator Scale: Bearish, Mildly Bearish, Sideways, Mildly Bullish, Bullish Turned
 Shareholding Snapshot : Mar 2026
Shareholding Compare (%holding)
Promoters
None
Held by 0 Schemes
Held by 4 FIIs (0.02%)
Enkei Corporation (74.97%)
Nastic Trading Llp (3.17%)
15.22%
Quarterly Results Snapshot (Standalone) - Mar'26 - QoQ

QoQ Growth in quarter ended Mar 2026 is 21.88% vs -7.44% in Dec 2025

QoQ Growth in quarter ended Mar 2026 is -114.49% vs -46.98% in Dec 2025
Half Yearly Results Snapshot (Standalone) - Jun'25
Growth in half year ended Jun 2025 is 12.30% vs 32.84% in Jun 2024
Growth in half year ended Jun 2025 is -168.86% vs 179.67% in Jun 2024
Nine Monthly Results Snapshot (Standalone) - Sep'25
YoY Growth in nine months ended Sep 2025 is 11.86% vs 25.85% in Sep 2024
YoY Growth in nine months ended Sep 2025 is -83.45% vs -41.40% in Sep 2024
Annual Results Snapshot (Standalone) - Dec'25
YoY Growth in year ended Dec 2025 is 15.06% vs 17.92% in Dec 2024
YoY Growth in year ended Dec 2025 is 92.86% vs -77.26% in Dec 2024
About Enkei Wheels India Ltd

Company Coordinates


